2Q8M

T-like Fructose-1,6-bisphosphatase from Escherichia coli with AMP, Glucose 6-phosphate, and Fructose 1,6-bisphosphate bound


Experimental Data Snapshot

  • Method: X-RAY DIFFRACTION
  • Resolution: 2.05 Å
  • R-Value Free: 0.235 
  • R-Value Work: 0.209 
  • R-Value Observed: 0.212 

wwPDB Validation   3D Report Full Report


Ligand Structure Quality Assessment 


This is version 1.5 of the entry. See complete history


Literature

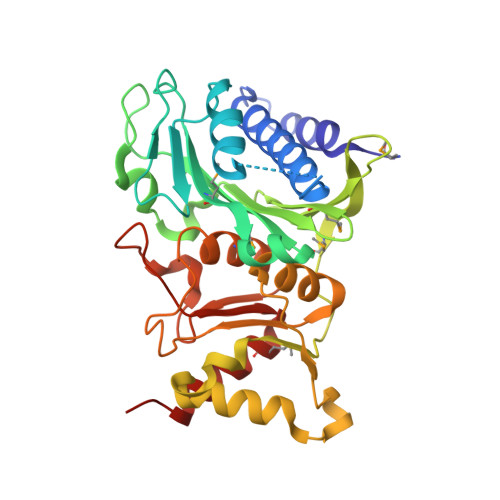
Structure of Inhibited Fructose-1,6-bisphosphatase from Escherichia coli: DISTINCT ALLOSTERIC INHIBITION SITES FOR AMP AND GLUCOSE 6-PHOSPHATE AND THE CHARACTERIZATION OF A GLUCONEOGENIC SWITCH.

Hines, J.K.Kruesel, C.E.Fromm, H.J.Honzatko, R.B.

(2007) J Biol Chem 282: 24697-24706

  • DOI: https://doi.org/10.1074/jbc.M703580200
  • Primary Citation of Related Structures:  
    2Q8M

  • PubMed Abstract: 

    Allosteric activation of fructose-1,6-bisphosphatase (FBPase) from Escherichia coli by phosphoenolpyruvate implies rapid feed-forward activation of gluconeogenesis in heterotrophic bacteria. But how do such bacteria rapidly down-regulate an activated FBPase in order to avoid futile cycling? Demonstrated here is the allosteric inhibition of E. coli FBPase by glucose 6-phosphate (Glc-6-P), the first metabolite produced upon glucose transport into the cell. FBPase undergoes a quaternary transition from the canonical R-state to a T-like state in response to Glc-6-P and AMP ligation. By displacing Phe(15), AMP binds to an allosteric site comparable with that of mammalian FBPase. Relative movements in helices H1 and H2 perturb allosteric activator sites for phosphoenolpyruvate. Glc-6-P binds to allosteric sites heretofore not observed in previous structures, perturbing subunits that in pairs form complete active sites of FBPase. Glc-6-P and AMP are synergistic inhibitors of E. coli FBPase, placing AMP/Glc-6-P inhibition in bacteria as a possible evolutionary predecessor to AMP/fructose 2,6-bisphosphate inhibition in mammalian FBPases. With no exceptions, signature residues of allosteric activation appear in bacterial sequences along with key residues of the Glc-6-P site. FBPases in such organisms may be components of metabolic switches that allow rapid changeover between gluconeogenesis and glycolysis in response to nutrient availability.


  • Organizational Affiliation

    Department of Biochemistry, Biophysics, and Molecular Biology, Iowa State University, Ames, Iowa 50011, USA.


Macromolecules
Find similar proteins by:  (by identity cutoff)  |  3D Structure
Entity ID: 1
MoleculeChains Sequence LengthOrganismDetailsImage
Fructose-bisphosphatase
A, B
332Shigella boydiiMutation(s): 6 
Gene Names: fbp
EC: 3.1.3.11
UniProt
Find proteins for P0A993 (Escherichia coli (strain K12))
Explore P0A993 
Go to UniProtKB:  P0A993
Entity Groups  
Sequence Clusters30% Identity50% Identity70% Identity90% Identity95% Identity100% Identity
UniProt GroupP0A993
Sequence Annotations
Expand
  • Reference Sequence
Small Molecules
Ligands 5 Unique
IDChains Name / Formula / InChI Key2D Diagram3D Interactions
AMP
Query on AMP

Download Ideal Coordinates CCD File 
I [auth A],
N [auth B]
ADENOSINE MONOPHOSPHATE
C10 H14 N5 O7 P
UDMBCSSLTHHNCD-KQYNXXCUSA-N
FBP
Query on FBP

Download Ideal Coordinates CCD File 
D [auth A],
J [auth B]
1,6-di-O-phosphono-beta-D-fructofuranose
C6 H14 O12 P2
RNBGYGVWRKECFJ-ARQDHWQXSA-N
BG6
Query on BG6

Download Ideal Coordinates CCD File 
C [auth A]6-O-phosphono-beta-D-glucopyranose
C6 H13 O9 P
NBSCHQHZLSJFNQ-VFUOTHLCSA-N
CL
Query on CL

Download Ideal Coordinates CCD File 
G [auth A],
H [auth A],
M [auth B]
CHLORIDE ION
Cl
VEXZGXHMUGYJMC-UHFFFAOYSA-M
MG
Query on MG

Download Ideal Coordinates CCD File 
E [auth A],
F [auth A],
K [auth B],
L [auth B]
MAGNESIUM ION
Mg
JLVVSXFLKOJNIY-UHFFFAOYSA-N
Modified Residues  1 Unique
IDChains TypeFormula2D DiagramParent
MSE
Query on MSE
A, B
L-PEPTIDE LINKINGC5 H11 N O2 SeMET
Binding Affinity Annotations 
IDSourceBinding Affinity
AMP Binding MOAD:  2Q8M Ki: 9.40e+4 (nM) from 1 assay(s)
PDBBind:  2Q8M Ki: 9.40e+4 (nM) from 1 assay(s)
BG6 Binding MOAD:  2Q8M Ki: 7.00e+5 (nM) from 1 assay(s)
FBP Binding MOAD:  2Q8M IC50: 6000 (nM) from 1 assay(s)
Experimental Data & Validation

Experimental Data

  • Method: X-RAY DIFFRACTION
  • Resolution: 2.05 Å
  • R-Value Free: 0.235 
  • R-Value Work: 0.209 
  • R-Value Observed: 0.212 
  • Space Group: P 41 2 2
Unit Cell:
Length ( Å )Angle ( ˚ )
a = 124.64α = 90
b = 124.64β = 90
c = 132.28γ = 90
Software Package:
Software NamePurpose
d*TREKdata processing
CNSrefinement
PDB_EXTRACTdata extraction
CrystalCleardata collection
d*TREKdata reduction
d*TREKdata scaling
AMoREphasing

Structure Validation

View Full Validation Report


Ligand Structure Quality Assessment 


Entry History 

Deposition Data

Revision History  (Full details and data files)

  • Version 1.0: 2007-06-19
    Type: Initial release
  • Version 1.1: 2008-05-01
    Changes: Version format compliance
  • Version 1.2: 2011-07-13
    Changes: Derived calculations, Version format compliance
  • Version 1.3: 2020-07-29
    Type: Remediation
    Reason: Carbohydrate remediation
    Changes: Data collection, Database references, Derived calculations, Structure summary
  • Version 1.4: 2023-08-30
    Changes: Data collection, Database references, Refinement description, Structure summary
  • Version 1.5: 2023-11-15
    Changes: Data collection