Genetically encoded calcium indicators for multi-color neural activity imaging and combination with optogenetics.
Akerboom, J., Carreras Calderon, N., Tian, L., Wabnig, S., Prigge, M., Tolo, J., Gordus, A., Orger, M.B., Severi, K.E., Macklin, J.J., Patel, R., Pulver, S.R., Wardill, T.J., Fischer, E., Schuler, C., Chen, T.W., Sarkisyan, K.S., Marvin, J.S., Bargmann, C.I., Kim, D.S., Kugler, S., Lagnado, L., Hegemann, P., Gottschalk, A., Schreiter, E.R., Looger, L.L.(2013) Front Mol Neurosci 6: 2-2
- PubMed: 23459413
- DOI: https://doi.org/10.3389/fnmol.2013.00002
- Primary Citation of Related Structures:
3U0K, 3U0L, 3U0M, 3U0N, 4I2Y - PubMed Abstract:
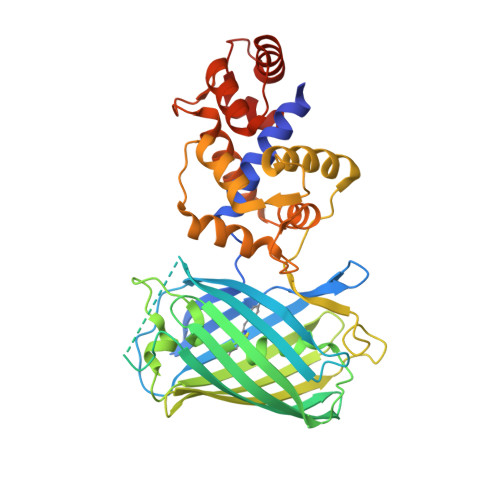
Genetically encoded calcium indicators (GECIs) are powerful tools for systems neuroscience. Here we describe red, single-wavelength GECIs, "RCaMPs," engineered from circular permutation of the thermostable red fluorescent protein mRuby. High-resolution crystal structures of mRuby, the red sensor RCaMP, and the recently published red GECI R-GECO1 give insight into the chromophore environments of the Ca(2+)-bound state of the sensors and the engineered protein domain interfaces of the different indicators. We characterized the biophysical properties and performance of RCaMP sensors in vitro and in vivo in Caenorhabditis elegans, Drosophila larvae, and larval zebrafish. Further, we demonstrate 2-color calcium imaging both within the same cell (registering mitochondrial and somatic [Ca(2+)]) and between two populations of cells: neurons and astrocytes. Finally, we perform integrated optogenetics experiments, wherein neural activation via channelrhodopsin-2 (ChR2) or a red-shifted variant, and activity imaging via RCaMP or GCaMP, are conducted simultaneously, with the ChR2/RCaMP pair providing independently addressable spectral channels. Using this paradigm, we measure calcium responses of naturalistic and ChR2-evoked muscle contractions in vivo in crawling C. elegans. We systematically compare the RCaMP sensors to R-GECO1, in terms of action potential-evoked fluorescence increases in neurons, photobleaching, and photoswitching. R-GECO1 displays higher Ca(2+) affinity and larger dynamic range than RCaMP, but exhibits significant photoactivation with blue and green light, suggesting that integrated channelrhodopsin-based optogenetics using R-GECO1 may be subject to artifact. Finally, we create and test blue, cyan, and yellow variants engineered from GCaMP by rational design. This engineered set of chromatic variants facilitates new experiments in functional imaging and optogenetics.
- Janelia Farm Research Campus, Howard Hughes Medical Institute Ashburn, VA, USA.
Organizational Affiliation: