


KatE H392C from Escherichia coli
Park, J.B., Cho, H.-S.To be published.
Experimental Data Snapshot
Starting Model: experimental
View more details
Entity ID: 1 | |||||
|---|---|---|---|---|---|
| Molecule | Chains | Sequence Length | Organism | Details | Image |
| Catalase | 753 | Escherichia coli ISC7 | Mutation(s): 1 EC: 1.11.1.6 | 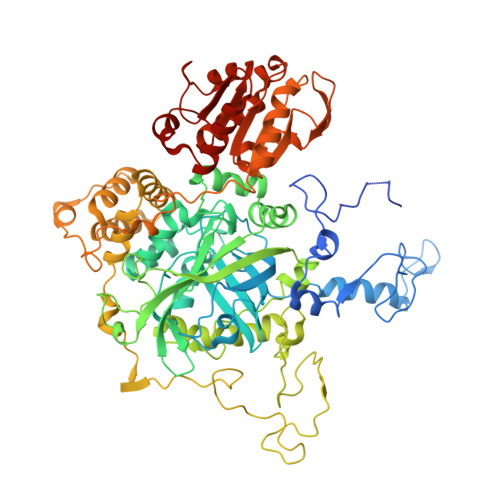 | |
UniProt | |||||
Entity Groups | |||||
| Sequence Clusters | 30% Identity50% Identity70% Identity90% Identity95% Identity100% Identity | ||||
| UniProt Group | W1F4G9 | ||||
Sequence AnnotationsExpand | |||||
Reference Sequence | |||||
| Ligands 2 Unique | |||||
|---|---|---|---|---|---|
| ID | Chains | Name / Formula / InChI Key | 2D Diagram | 3D Interactions | |
| HEM (Subject of Investigation/LOI) Download:Ideal Coordinates CCD File | E [auth A], F [auth B], G [auth C], I [auth D] | PROTOPORPHYRIN IX CONTAINING FE C34 H32 Fe N4 O4 KABFMIBPWCXCRK-RGGAHWMASA-L |  | ||
| EDO Download:Ideal Coordinates CCD File | H [auth C] | 1,2-ETHANEDIOL C2 H6 O2 LYCAIKOWRPUZTN-UHFFFAOYSA-N |  | ||
| Length ( Å ) | Angle ( ˚ ) |
|---|---|
| a = 90.345 | α = 90 |
| b = 129.099 | β = 109.86 |
| c = 117.372 | γ = 90 |
| Software Name | Purpose |
|---|---|
| REFMAC | refinement |
| HKL-2000 | data reduction |
| HKL-2000 | data scaling |
| MOLREP | phasing |
| Funding Organization | Location | Grant Number |
|---|---|---|
| National Research Foundation (Korea) | Korea, Republic Of | -- |


