Structural Basis for Antigenic Peptide Recognition and Processing by Endoplasmic Reticulum (Er) Aminopeptidase 2.
Mpakali, A., Giastas, P., Mathioudakis, N., Mavridis, I.M., Saridakis, E., Stratikos, E.(2015) J Biological Chem 290: 26021
- PubMed: 26381406 Search on PubMedSearch on PubMed Central
- DOI: https://doi.org/10.1074/jbc.M115.685909
- Primary Citation Related Structures:
5AB0, 5AB2, 5CU5 - PubMed Abstract:
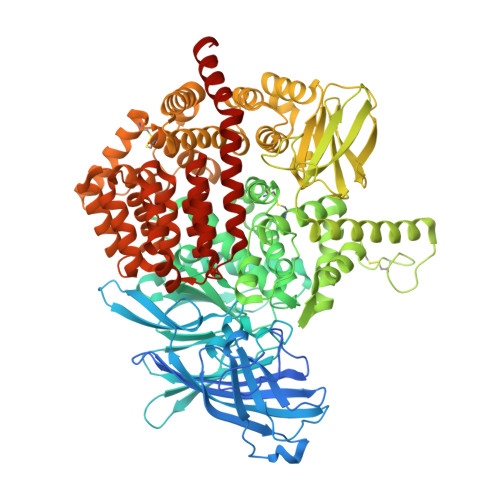
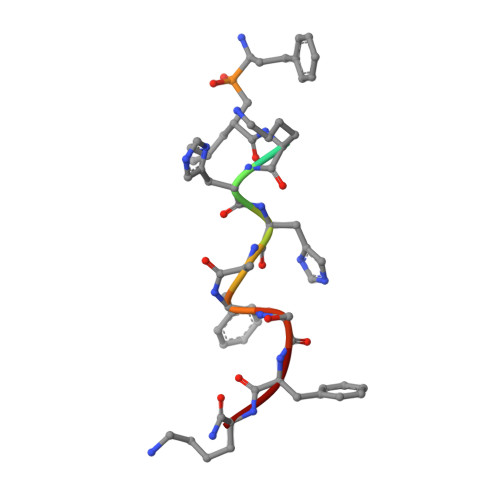
Endoplasmic reticulum (ER) aminopeptidases process antigenic peptide precursors to generate epitopes for presentation by MHC class I molecules and help shape the antigenic peptide repertoire and cytotoxic T-cell responses. To perform this function, ER aminopeptidases have to recognize and process a vast variety of peptide sequences. To understand how these enzymes recognize substrates, we determined crystal structures of ER aminopeptidase 2 (ERAP2) in complex with a substrate analogue and a peptidic product to 2.5 and 2.7 Å, respectively, and compared them to the apo-form structure determined to 3.0 Å. The peptides were found within the internal cavity of the enzyme with no direct access to the outside solvent. The substrate analogue extends away from the catalytic center toward the distal end of the internal cavity, making interactions with several shallow pockets along the path. A similar configuration was evident for the peptidic product, although decreasing electron density toward its C terminus indicated progressive disorder. Enzymatic analysis confirmed that visualized interactions can either positively or negatively impact in vitro trimming rates. Opportunistic side-chain interactions and lack of deep specificity pockets support a limited-selectivity model for antigenic peptide processing by ERAP2. In contrast to proposed models for the homologous ERAP1, no specific recognition of the peptide C terminus by ERAP2 was evident, consistent with functional differences in length selection and self-activation between these two enzymes. Our results suggest that ERAP2 selects substrates by sequestering them in its internal cavity and allowing opportunistic interactions to determine trimming rates, thus combining substrate permissiveness with sequence bias.
- From the National Center for Scientific Research Demokritos, Agia Paraskevi, Athens 15310, Greece.
Organizational Affiliation: