A genetically encoded Ca2+indicator based on circularly permutated sea anemone red fluorescent protein eqFP578.
Shen, Y., Dana, H., Abdelfattah, A.S., Patel, R., Shea, J., Molina, R.S., Rawal, B., Rancic, V., Chang, Y.F., Wu, L., Chen, Y., Qian, Y., Wiens, M.D., Hambleton, N., Ballanyi, K., Hughes, T.E., Drobizhev, M., Kim, D.S., Koyama, M., Schreiter, E.R., Campbell, R.E.(2018) BMC Biol 16: 9-9
- PubMed: 29338710 Search on PubMedSearch on PubMed Central
- DOI: https://doi.org/10.1186/s12915-018-0480-0
- Primary Citation Related Structures:
5UKG - PubMed Abstract:
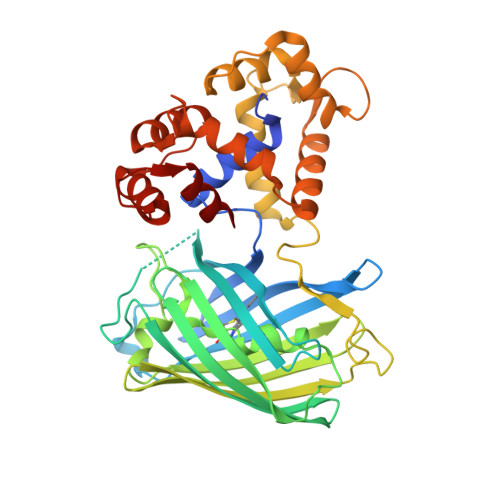
Genetically encoded calcium ion (Ca 2+ ) indicators (GECIs) are indispensable tools for measuring Ca 2+ dynamics and neuronal activities in vitro and in vivo. Red fluorescent protein (RFP)-based GECIs have inherent advantages relative to green fluorescent protein-based GECIs due to the longer wavelength light used for excitation. Longer wavelength light is associated with decreased phototoxicity and deeper penetration through tissue. Red GECI can also enable multicolor visualization with blue- or cyan-excitable fluorophores. Here we report the development, structure, and validation of a new RFP-based GECI, K-GECO1, based on a circularly permutated RFP derived from the sea anemone Entacmaea quadricolor. We have characterized the performance of K-GECO1 in cultured HeLa cells, dissociated neurons, stem-cell-derived cardiomyocytes, organotypic brain slices, zebrafish spinal cord in vivo, and mouse brain in vivo. K-GECO1 is the archetype of a new lineage of GECIs based on the RFP eqFP578 scaffold. It offers high sensitivity and fast kinetics, similar or better than those of current state-of-the-art indicators, with diminished lysosomal accumulation and minimal blue-light photoactivation. Further refinements of the K-GECO1 lineage could lead to further improved variants with overall performance that exceeds that of the most highly optimized red GECIs.
- Department of Chemistry, University of Alberta, Edmonton, Alberta, T6G 2G2, Canada.
Organizational Affiliation: