4Z7V

L3-12 complex


Experimental Data Snapshot

  • Method: X-RAY DIFFRACTION
  • Resolution: 2.65 Å
  • R-Value Free: 0.226 
  • R-Value Work: 0.187 
  • R-Value Observed: 0.189 

wwPDB Validation   3D Report Full Report


Ligand Structure Quality Assessment 


This is version 2.1 of the entry. See complete history


Literature

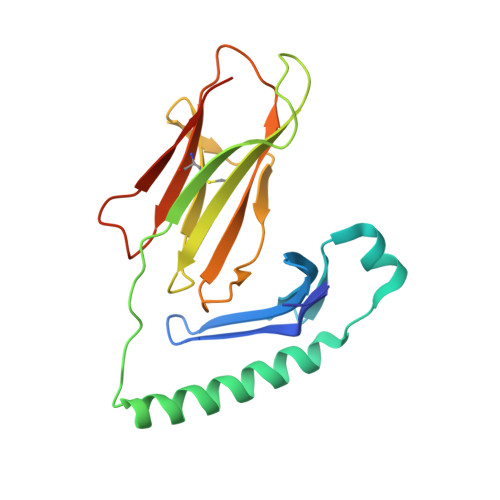
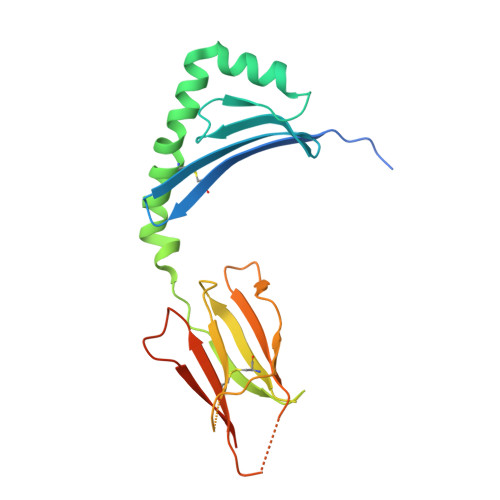
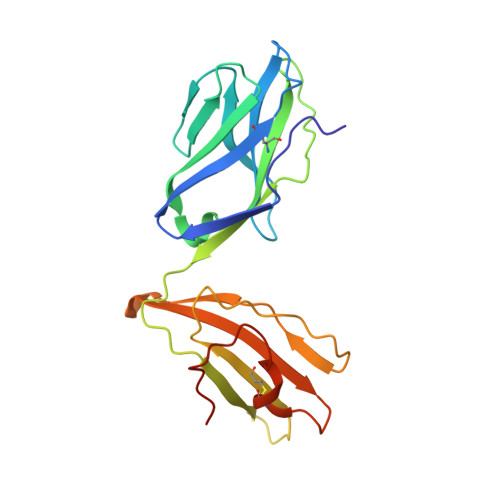
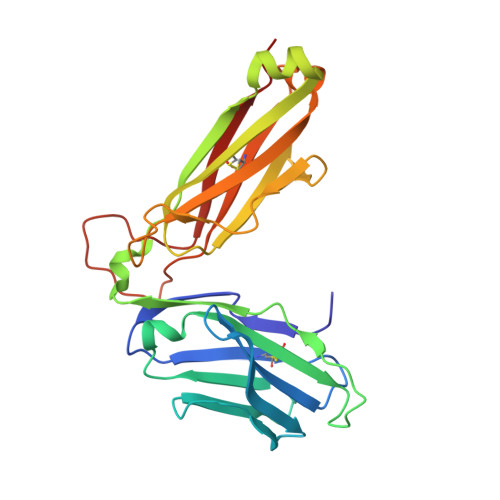
Determinants of Gliadin-Specific T Cell Selection in Celiac Disease.

Petersen, J.van Bergen, J.Loh, K.L.Kooy-Winkelaar, Y.Beringer, D.X.Thompson, A.Bakker, S.F.Mulder, C.J.Ladell, K.McLaren, J.E.Price, D.A.Rossjohn, J.Reid, H.H.Koning, F.

(2015) J Immunol 194: 6112-6122

  • DOI: https://doi.org/10.4049/jimmunol.1500161
  • Primary Citation of Related Structures:  
    4Z7U, 4Z7V, 4Z7W

  • PubMed Abstract: 

    In HLA-DQ8-associated celiac disease (CD), the pathogenic T cell response is directed toward an immunodominant α-gliadin-derived peptide (DQ8-glia-α1). However, our knowledge of TCR gene usage within the primary intestinal tissue of HLA-DQ8 (+) CD patients is limited. We identified two populations of HLA-DQ8-glia-α1 tetramer(+) CD4(+) T cells that were essentially undetectable in biopsy samples from patients on a gluten-free diet but expanded rapidly and specifically after antigenic stimulation. Distinguished by expression of TRBV9, both T cell populations displayed biased clonotypic repertoires and reacted similarly against HLA-DQ8-glia-α1. In particular, TRBV9 paired most often with TRAV26-2, whereas the majority of TRBV9(-) TCRs used TRBV6-1 with no clear TRAV gene preference. Strikingly, both tetramer(+)/TRBV9(+) and tetramer(+)/TRBV9(-) T cells possessed a non-germline-encoded arginine residue in their CDR3α and CDR3β loops, respectively. Comparison of the crystal structures of three TRBV9(+) TCRs and a TRBV9(-) TCR revealed that, as a result of distinct TCR docking modes, the HLA-DQ8-glia-α1 contacts mediated by the CDR3-encoded arginine were almost identical between TRBV9(+) and TRBV9(-) TCRs. In all cases, this interaction centered on two hydrogen bonds with a specific serine residue in the bound peptide. Replacement of serine with alanine at this position abrogated TRBV9(+) and TRBV9(-) clonal T cell proliferation in response to HLA-DQ8-glia-α1. Gluten-specific memory CD4(+) T cells with structurally and functionally conserved TCRs therefore predominate in the disease-affected tissue of patients with HLA-DQ8-mediated CD.


  • Organizational Affiliation

    Department of Biochemistry and Molecular Biology, School of Biomedical Sciences, Monash University, Clayton, Victoria 3800, Australia; Australian Research Council Centre of Excellence in Advanced Molecular Imaging, Monash University, Clayton, Victoria 3800, Australia;


Macromolecules
Find similar proteins by:  (by identity cutoff)  |  3D Structure
Entity ID: 1
MoleculeChains Sequence LengthOrganismDetailsImage
MHC class II HLA-DQ-alpha chain
A, C
192Homo sapiensMutation(s): 0 
Gene Names: HLA-DQA1
UniProt
Find proteins for Q30069 (Homo sapiens)
Explore Q30069 
Go to UniProtKB:  Q30069
Entity Groups  
Sequence Clusters30% Identity50% Identity70% Identity90% Identity95% Identity100% Identity
UniProt GroupQ30069
Sequence Annotations
Expand
  • Reference Sequence
Find similar proteins by:  (by identity cutoff)  |  3D Structure
Entity ID: 2
MoleculeChains Sequence LengthOrganismDetailsImage
MHC class II HLA-DQ-beta-1
B, D
213Homo sapiensMutation(s): 0 
Gene Names: HLA-DQB1
UniProt
Find proteins for O19707 (Homo sapiens)
Explore O19707 
Go to UniProtKB:  O19707
Entity Groups  
Sequence Clusters30% Identity50% Identity70% Identity90% Identity95% Identity100% Identity
UniProt GroupO19707
Sequence Annotations
Expand
  • Reference Sequence
Find similar proteins by:  (by identity cutoff)  |  3D Structure
Entity ID: 3
MoleculeChains Sequence LengthOrganismDetailsImage
T-CELL RECEPTOR, L3-12 ALPHA CHAIN
E, G
204Homo sapiensMutation(s): 0 
Entity Groups  
Sequence Clusters30% Identity50% Identity70% Identity90% Identity95% Identity100% Identity
Sequence Annotations
Expand
  • Reference Sequence
Find similar proteins by:  (by identity cutoff)  |  3D Structure
Entity ID: 4
MoleculeChains Sequence LengthOrganismDetailsImage
T-CELL RECEPTOR, L3-12 BETA CHAIN
F, H
244Homo sapiensMutation(s): 0 
Entity Groups  
Sequence Clusters30% Identity50% Identity70% Identity90% Identity95% Identity100% Identity
Sequence Annotations
Expand
  • Reference Sequence

Find similar proteins by:  Sequence   |   3D Structure  

Entity ID: 5
MoleculeChains Sequence LengthOrganismDetailsImage
deamidated DQ8-glia-alpha1 peptide
I, J
18Triticum aestivumMutation(s): 0 
UniProt
Find proteins for P18573 (Triticum aestivum)
Explore P18573 
Go to UniProtKB:  P18573
Entity Groups  
Sequence Clusters30% Identity50% Identity70% Identity90% Identity95% Identity100% Identity
UniProt GroupP18573
Sequence Annotations
Expand
  • Reference Sequence
Oligosaccharides

Help

Entity ID: 6
MoleculeChains Length2D Diagram Glycosylation3D Interactions
alpha-D-mannopyranose-(1-4)-alpha-D-mannopyranose-(1-4)-2-acetamido-2-deoxy-beta-D-glucopyranose-(1-4)-[alpha-L-fucopyranose-(1-3)][alpha-L-fucopyranose-(1-6)]2-acetamido-2-deoxy-beta-D-glucopyranose
K
6N-Glycosylation
Glycosylation Resources
GlyTouCan:  G73409CU
GlyCosmos:  G73409CU
GlyGen:  G73409CU
Entity ID: 7
MoleculeChains Length2D Diagram Glycosylation3D Interactions
alpha-L-fucopyranose-(1-3)-[2-acetamido-2-deoxy-beta-D-glucopyranose-(1-4)][alpha-L-fucopyranose-(1-6)]2-acetamido-2-deoxy-beta-D-glucopyranose
L
4N-Glycosylation
Glycosylation Resources
GlyTouCan:  G63564LA
GlyCosmos:  G63564LA
Small Molecules
Ligands 1 Unique
IDChains Name / Formula / InChI Key2D Diagram3D Interactions
NAG
Query on NAG

Download Ideal Coordinates CCD File 
M [auth A],
N [auth C]
2-acetamido-2-deoxy-beta-D-glucopyranose
C8 H15 N O6
OVRNDRQMDRJTHS-FMDGEEDCSA-N
Experimental Data & Validation

Experimental Data

  • Method: X-RAY DIFFRACTION
  • Resolution: 2.65 Å
  • R-Value Free: 0.226 
  • R-Value Work: 0.187 
  • R-Value Observed: 0.189 
  • Space Group: P 1
Unit Cell:
Length ( Å )Angle ( ˚ )
a = 56.51α = 93.87
b = 76.961β = 89.47
c = 132.279γ = 105.09
Software Package:
Software NamePurpose
BUSTERrefinement
XDSdata reduction
SCALAdata scaling
PHASERphasing

Structure Validation

View Full Validation Report


Ligand Structure Quality Assessment 


Entry History 

Deposition Data

Revision History  (Full details and data files)

  • Version 1.0: 2015-06-03
    Type: Initial release
  • Version 1.1: 2015-06-17
    Changes: Database references
  • Version 1.2: 2017-08-23
    Changes: Data collection, Derived calculations, Source and taxonomy
  • Version 2.0: 2020-07-29
    Type: Remediation
    Reason: Carbohydrate remediation
    Changes: Advisory, Atomic model, Data collection, Derived calculations, Structure summary
  • Version 2.1: 2023-09-27
    Changes: Data collection, Database references, Derived calculations, Refinement description, Structure summary