Structure and function of 1-tetrahydrocannabinolic acid (THCA) synthase, the enzyme controlling the psychoactivity of Cannabis sativa
Shoyama, Y., Tamada, T., Kurihara, K., Takeuchi, A., Taura, F., Arai, S., Blaber, M., Shoyama, Y., Morimoto, S., Kuroki, R.(2012) J Mol Biol 423: 96-105
- PubMed: 22766313 Search on PubMed
- DOI: https://doi.org/10.1016/j.jmb.2012.06.030
- Primary Citation Related Structures:
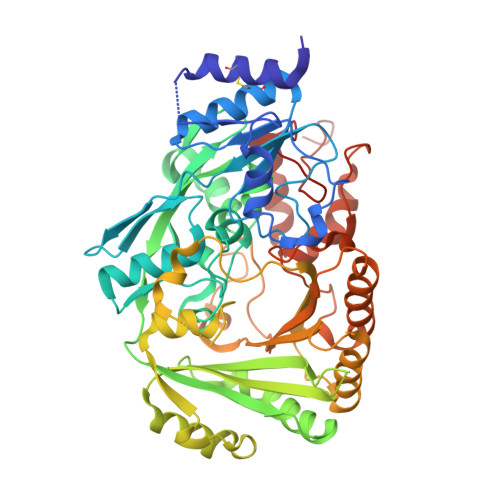
3VTE - PubMed Abstract:
∆1-Tetrahydrocannabinolic acid (THCA) synthase catalyzes the oxidative cyclization of cannabigerolic acid (CBGA) into THCA, the precursor of the primary psychoactive agent ∆1-tetrahydrocannabinol in Cannabis sativa. The enzyme was overproduced in insect cells, purified, and crystallized in order to investigate the structure-function relationship of THCA synthase, and the tertiary structure was determined to 2.75Å resolution by X-ray crystallography (R(cryst)=19.9%). The THCA synthase enzyme is a member of the p-cresol methyl-hydroxylase superfamily, and the tertiary structure is divided into two domains (domains I and II), with a flavin adenine dinucleotide coenzyme positioned between each domain and covalently bound to His114 and Cys176 (located in domain I). The catalysis of THCA synthesis involves a hydride transfer from C3 of CBGA to N5 of flavin adenine dinucleotide and the deprotonation of O6' of CBGA. The ionized residues in the active site of THCA synthase were investigated by mutational analysis and X-ray structure. Mutational analysis indicates that the reaction does not involve the carboxyl group of Glu442 that was identified as the catalytic base in the related berberine bridge enzyme but instead involves the hydroxyl group of Tyr484. Mutations at the active-site residues His292 and Tyr417 resulted in a decrease in, but not elimination of, the enzymatic activity of THCA synthase, suggesting a key role for these residues in substrate binding and not direct catalysis.
- Quantum Beam Science Directorate, Japan Atomic Energy Agency, 2-4 Shirakata-Shirane, Tokai, Ibaraki 319-1195, Japan. yoshinari_shoyama@nmp.co.jp
Organizational Affiliation: