2IZV

CRYSTAL STRUCTURE OF SOCS-4 IN COMPLEX WITH ELONGIN-B AND ELONGIN-C AT 2.55A RESOLUTION


Experimental Data Snapshot

  • Method: X-RAY DIFFRACTION
  • Resolution: 2.55 Å
  • R-Value Free: 0.223 
  • R-Value Work: 0.172 
  • R-Value Observed: 0.175 

wwPDB Validation   3D Report Full Report


This is version 1.4 of the entry. See complete history


Literature

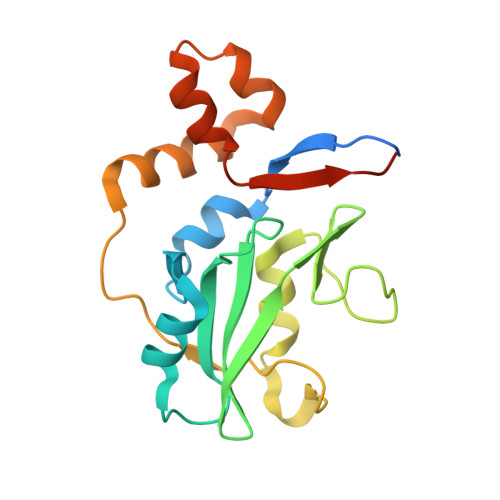
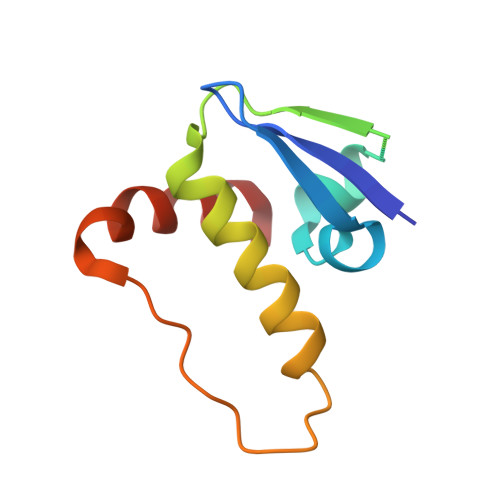
Structure of the SOCS4-ElonginB/C complex reveals a distinct SOCS box interface and the molecular basis for SOCS-dependent EGFR degradation.

Bullock, A.N.Rodriguez, M.C.Debreczeni, J.E.Songyang, Z.Knapp, S.

(2007) Structure 15: 1493-1504

  • DOI: https://doi.org/10.1016/j.str.2007.09.016
  • Primary Citation of Related Structures:  
    2IZV

  • PubMed Abstract: 
  • Tyrosine kinase signaling is tightly controlled by negative feedback inhibitors including suppressors of cytokine signaling (SOCS). SOCS assemble as SH2 domain substrate recognition modules in ElonginB/C-cullin ubiquitin ligases. In accordance, SOCS4 reduces STAT3 signaling from EGFR through increased receptor degradation ...

    Tyrosine kinase signaling is tightly controlled by negative feedback inhibitors including suppressors of cytokine signaling (SOCS). SOCS assemble as SH2 domain substrate recognition modules in ElonginB/C-cullin ubiquitin ligases. In accordance, SOCS4 reduces STAT3 signaling from EGFR through increased receptor degradation. Variable C-termini in SOCS4-SOCS7 exclude these family members from a SOCS2-type domain arrangement in which a strictly conserved C terminus determines domain packing. The structure of the SOCS4-ElonginC-ElonginB complex reveals a distinct SOCS structural class. The N-terminal ESS helix functionally replaces the CIS/SOCS1-SOCS3 family C terminus in a distinct SH2-SOCS box interface that facilitates further interdomain packing between the extended N- and C-terminal regions characteristic for this subfamily. Using peptide arrays and calorimetry the STAT3 site in EGFR (pY(1092)) was identified as a high affinity SOCS4 substrate (K(D) = 0.5 microM) revealing a mechanism for EGFR degradation. SOCS4 also bound JAK2 and KIT with low micromolar affinity, whereas SOCS2 was specific for GH-receptor.


    Organizational Affiliation

    University of Oxford, Structural Genomics Consortium, Botnar Research Centre, Oxford OX3 7LD, United Kingdom. alex.bullock@sgc.ox.ac.uk


Macromolecules
Find similar proteins by:  (by identity cutoff)  |  3D Structure
Entity ID: 1
MoleculeChainsSequence LengthOrganismDetailsImage
SUPPRESSOR OF CYTOKINE SIGNALING 4A187Homo sapiensMutation(s): 0 
Gene Names: SOCS4SOCS7
UniProt & NIH Common Fund Data Resources
Find proteins for Q8WXH5 (Homo sapiens)
Explore Q8WXH5 
Go to UniProtKB:  Q8WXH5
PHAROS:  Q8WXH5
Entity Groups  
Sequence Clusters30% Identity50% Identity70% Identity90% Identity95% Identity100% Identity
UniProt GroupQ8WXH5
Protein Feature View
Expand
  • Reference Sequence
Find similar proteins by:  (by identity cutoff)  |  3D Structure
Entity ID: 2
MoleculeChainsSequence LengthOrganismDetailsImage
TRANSCRIPTION ELONGATION FACTOR B POLYPEPTIDE 2B118Homo sapiensMutation(s): 0 
Gene Names: ELOBTCEB2
UniProt & NIH Common Fund Data Resources
Find proteins for Q15370 (Homo sapiens)
Explore Q15370 
Go to UniProtKB:  Q15370
PHAROS:  Q15370
Entity Groups  
Sequence Clusters30% Identity50% Identity70% Identity90% Identity95% Identity100% Identity
UniProt GroupQ15370
Protein Feature View
Expand
  • Reference Sequence
Find similar proteins by:  (by identity cutoff)  |  3D Structure
Entity ID: 3
MoleculeChainsSequence LengthOrganismDetailsImage
TRANSCRIPTION ELONGATION FACTOR B POLYPEPTIDE 1C97Homo sapiensMutation(s): 0 
Gene Names: ELOCTCEB1
UniProt & NIH Common Fund Data Resources
Find proteins for Q15369 (Homo sapiens)
Explore Q15369 
Go to UniProtKB:  Q15369
PHAROS:  Q15369
Entity Groups  
Sequence Clusters30% Identity50% Identity70% Identity90% Identity95% Identity100% Identity
UniProt GroupQ15369
Protein Feature View
Expand
  • Reference Sequence
Small Molecules
Ligands 3 Unique
IDChainsName / Formula / InChI Key2D Diagram3D Interactions
EDO
Query on EDO

Download Ideal Coordinates CCD File 
E [auth A]1,2-ETHANEDIOL
C2 H6 O2
LYCAIKOWRPUZTN-UHFFFAOYSA-N
 Ligand Interaction
CL
Query on CL

Download Ideal Coordinates CCD File 
F [auth A]CHLORIDE ION
Cl
VEXZGXHMUGYJMC-UHFFFAOYSA-M
 Ligand Interaction
NA
Query on NA

Download Ideal Coordinates CCD File 
D [auth A]SODIUM ION
Na
FKNQFGJONOIPTF-UHFFFAOYSA-N
 Ligand Interaction
Experimental Data & Validation

Experimental Data

  • Method: X-RAY DIFFRACTION
  • Resolution: 2.55 Å
  • R-Value Free: 0.223 
  • R-Value Work: 0.172 
  • R-Value Observed: 0.175 
  • Space Group: H 3
Unit Cell:
Length ( Å )Angle ( ˚ )
a = 154.77α = 90
b = 154.77β = 90
c = 67.909γ = 120
Software Package:
Software NamePurpose
REFMACrefinement
MOSFLMdata reduction
SCALAdata scaling
PHASERphasing

Structure Validation

View Full Validation Report


Entry History 

Revision History  (Full details and data files)

  • Version 1.0: 2006-08-02
    Type: Initial release
  • Version 1.1: 2011-07-13
    Changes: Advisory, Version format compliance
  • Version 1.2: 2018-01-24
    Changes: Structure summary
  • Version 1.3: 2018-02-28
    Changes: Database references, Source and taxonomy
  • Version 1.4: 2019-05-08
    Changes: Data collection, Experimental preparation