6JI2

Crystal structure of archaeal ribosomal protein aP1, aPelota, and GTP-bound aEF1A complex


Experimental Data Snapshot

  • Method: X-RAY DIFFRACTION
  • Resolution: 3.00 Å
  • R-Value Free: 0.279 
  • R-Value Work: 0.199 
  • R-Value Observed: 0.203 

wwPDB Validation   3D Report Full Report


Ligand Structure Quality Assessment 


This is version 1.1 of the entry. See complete history


Literature

Switch of the interactions between the ribosomal stalk and EF1A in the GTP- and GDP-bound conformations.

Maruyama, K.Imai, H.Kawamura, M.Ishino, S.Ishino, Y.Ito, K.Uchiumi, T.

(2019) Sci Rep 9: 14761-14761

  • DOI: https://doi.org/10.1038/s41598-019-51266-x
  • Primary Citation of Related Structures:  
    6JI2

  • PubMed Abstract: 

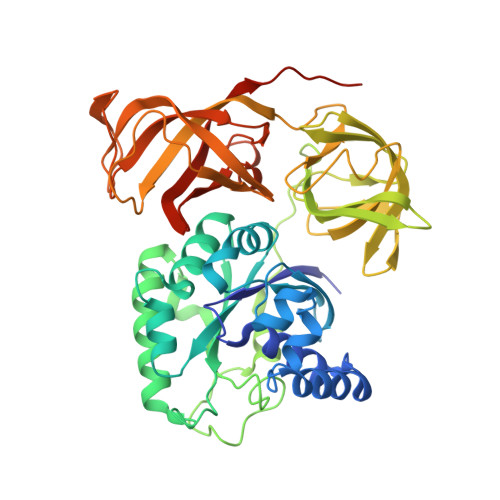
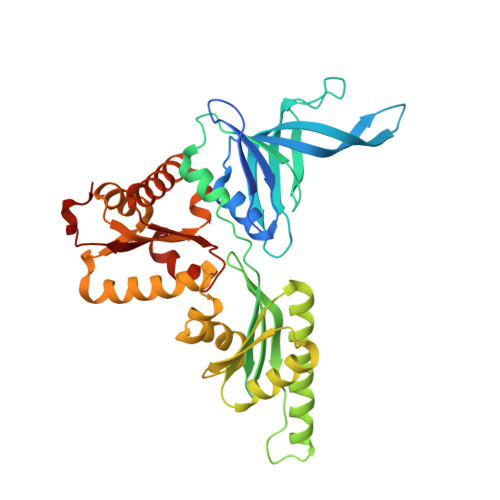
    Translation elongation factor EF1A delivers aminoacyl-tRNA to the ribosome in a GTP-bound form, and is released from the ribosome in a GDP-bound form. This association/dissociation cycle proceeds efficiently via a marked conformational change in EF1A. EF1A function is dependent on the ribosomal "stalk" protein of the ribosomal large subunit, although the precise mechanism of action of the stalk on EF1A remains unclear. Here, we clarify the binding mode of archaeal stalk aP1 to GTP-bound aEF1A associated with aPelota. Intriguingly, the C-terminal domain (CTD) of aP1 binds to aEF1A•GTP with a similar affinity to aEF1A•GDP. We have also determined the crystal structure of the aP1-CTD•aEF1A•GTP•aPelota complex at 3.0 Å resolution. The structure shows that aP1-CTD binds to a space between domains 1 and 3 of aEF1A. Biochemical analyses show that this binding is crucial for protein synthesis. Comparison of the structures of aP1-CTD•aEF1A•GTP and aP1-CTD•aEF1A•GDP demonstrates that the binding mode of aP1 changes markedly upon a conformational switch between the GTP- and GDP-bound forms of aEF1A. Taking into account biochemical data, we infer that aP1 employs its structural flexibility to bind to aEF1A before and after GTP hydrolysis for efficient protein synthesis.


  • Organizational Affiliation

    Department of Biology, Faculty of Science, Niigata University, Ikarashi 2-8050, Niigata, 950-2181, Japan.


Macromolecules
Find similar proteins by:  (by identity cutoff)  |  3D Structure
Entity ID: 1
MoleculeChains Sequence LengthOrganismDetailsImage
Elongation factor 1-alphaA,
C [auth E]
447Aeropyrum pernix K1Mutation(s): 0 
UniProt
Find proteins for Q9YAV0 (Aeropyrum pernix (strain ATCC 700893 / DSM 11879 / JCM 9820 / NBRC 100138 / K1))
Explore Q9YAV0 
Go to UniProtKB:  Q9YAV0
Entity Groups  
Sequence Clusters30% Identity50% Identity70% Identity90% Identity95% Identity100% Identity
UniProt GroupQ9YAV0
Sequence Annotations
Expand
  • Reference Sequence
Find similar proteins by:  (by identity cutoff)  |  3D Structure
Entity ID: 2
MoleculeChains Sequence LengthOrganismDetailsImage
Protein pelota homologB,
D [auth F]
376Aeropyrum pernix K1Mutation(s): 0 
EC: 3.1
UniProt
Find proteins for Q9YAZ5 (Aeropyrum pernix (strain ATCC 700893 / DSM 11879 / JCM 9820 / NBRC 100138 / K1))
Explore Q9YAZ5 
Go to UniProtKB:  Q9YAZ5
Entity Groups  
Sequence Clusters30% Identity50% Identity70% Identity90% Identity95% Identity100% Identity
UniProt GroupQ9YAZ5
Sequence Annotations
Expand
  • Reference Sequence

Find similar proteins by:  Sequence   |   3D Structure  

Entity ID: 3
MoleculeChains Sequence LengthOrganismDetailsImage
Archaeal ribosomal stalk protein aP1E [auth X]17Aeropyrum pernix K1Mutation(s): 0 
UniProt
Find proteins for Q9Y9W9 (Aeropyrum pernix (strain ATCC 700893 / DSM 11879 / JCM 9820 / NBRC 100138 / K1))
Explore Q9Y9W9 
Go to UniProtKB:  Q9Y9W9
Entity Groups  
Sequence Clusters30% Identity50% Identity70% Identity90% Identity95% Identity100% Identity
UniProt GroupQ9Y9W9
Sequence Annotations
Expand
  • Reference Sequence
Experimental Data & Validation

Experimental Data

  • Method: X-RAY DIFFRACTION
  • Resolution: 3.00 Å
  • R-Value Free: 0.279 
  • R-Value Work: 0.199 
  • R-Value Observed: 0.203 
  • Space Group: P 1
Unit Cell:
Length ( Å )Angle ( ˚ )
a = 71.447α = 98.64
b = 73.405β = 93.8
c = 108.142γ = 100.44
Software Package:
Software NamePurpose
REFMACrefinement
HKL-2000data reduction
HKL-2000data scaling
BALBESphasing

Structure Validation

View Full Validation Report


Ligand Structure Quality Assessment 


Entry History 

Deposition Data

Revision History  (Full details and data files)

  • Version 1.0: 2019-11-13
    Type: Initial release
  • Version 1.1: 2023-11-22
    Changes: Data collection, Database references, Derived calculations, Refinement description