


Structural insight into activation mechanism of SAMHD1
Xiaohong, Q., Yanhong, L., Jia, K., Xiaofang, Y.To be published.
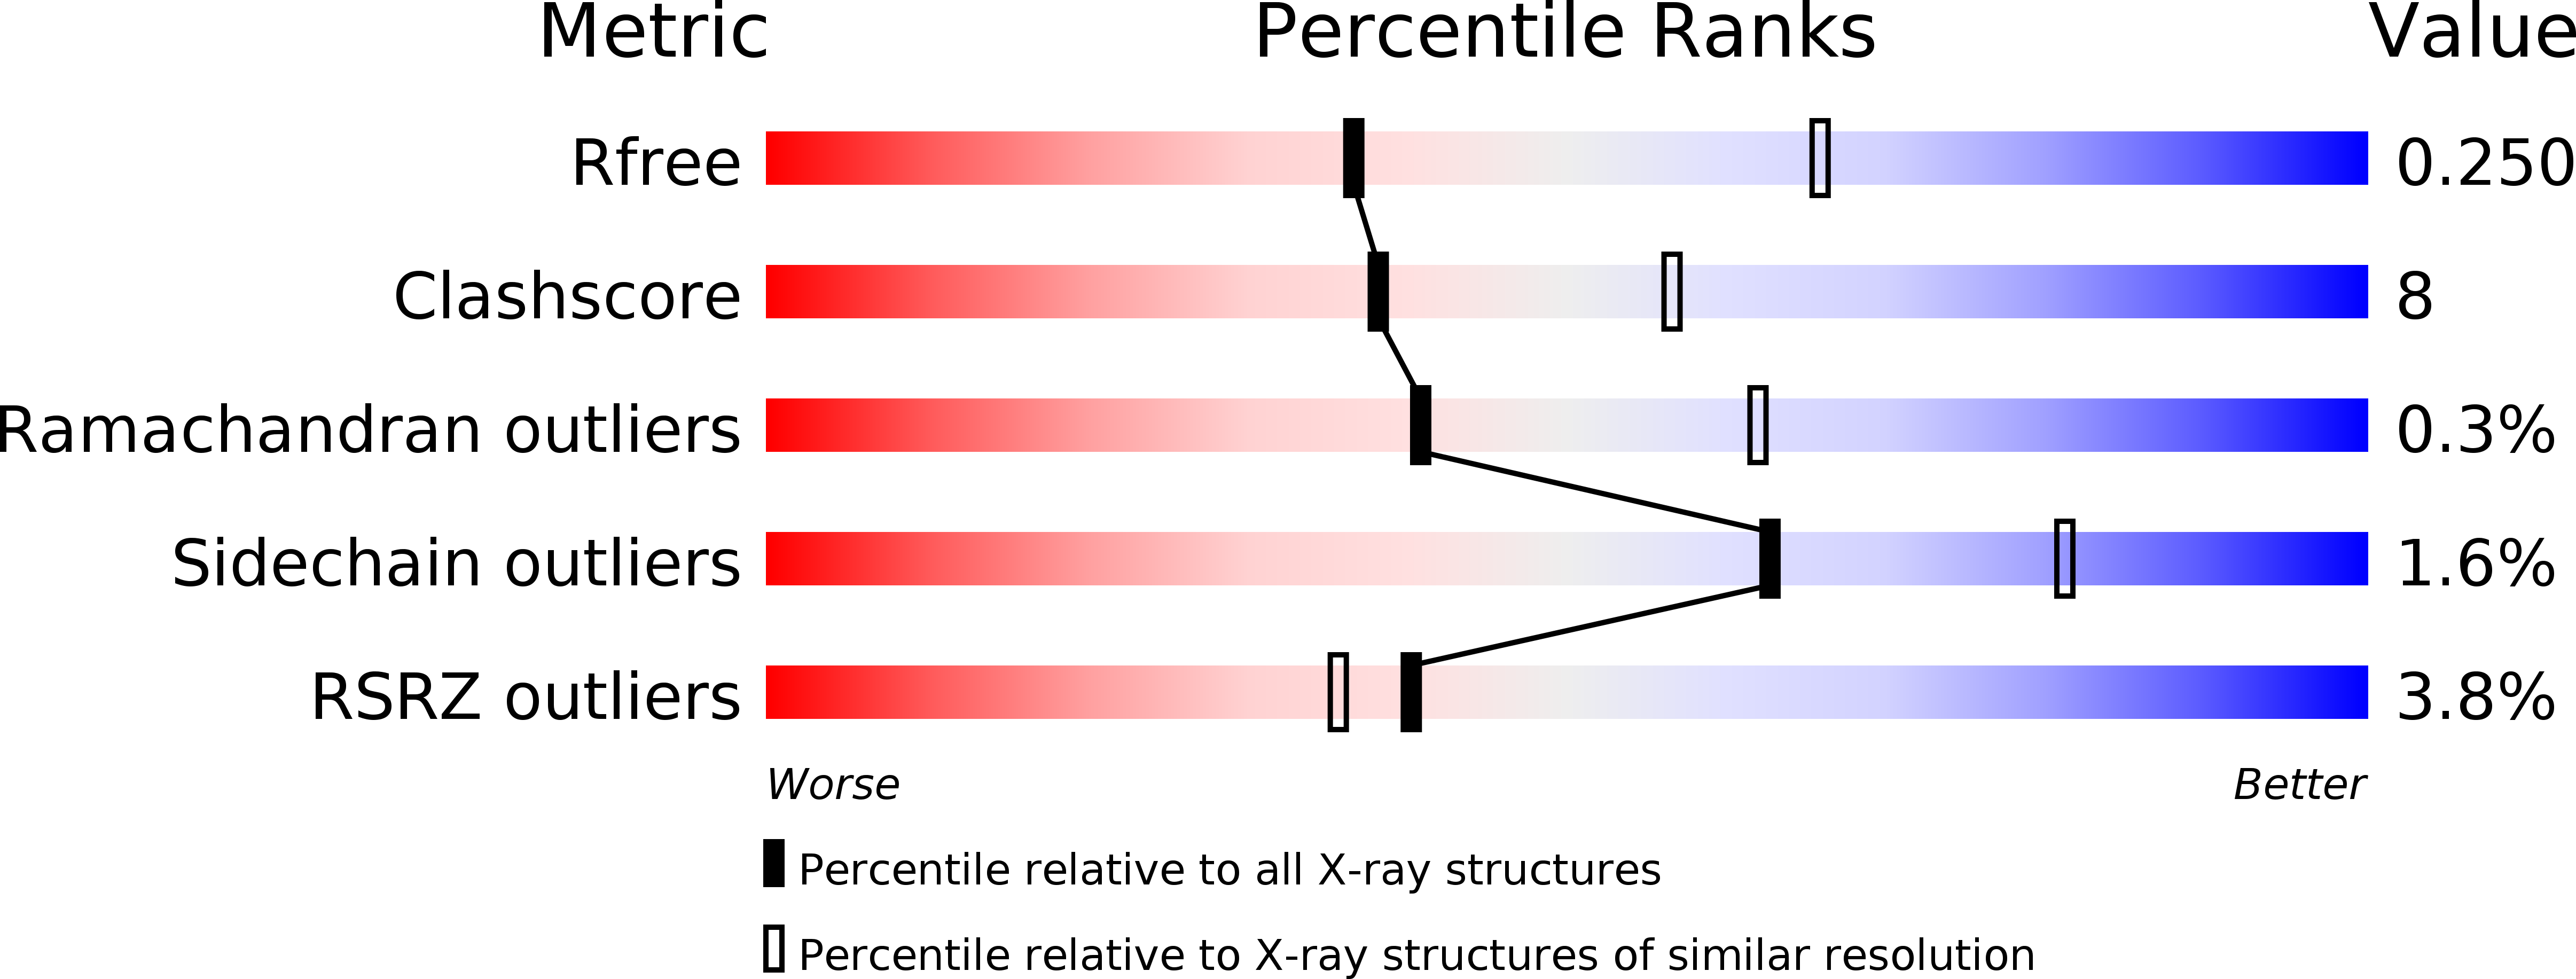
Experimental Data Snapshot
Entity ID: 1 | |||||
|---|---|---|---|---|---|
| Molecule | Chains | Sequence Length | Organism | Details | Image |
| Deoxynucleoside triphosphate triphosphohydrolase SAMHD1 | 526 | Homo sapiens | Mutation(s): 1 Gene Names: SAMHD1, MOP5 EC: 3.1.5 | 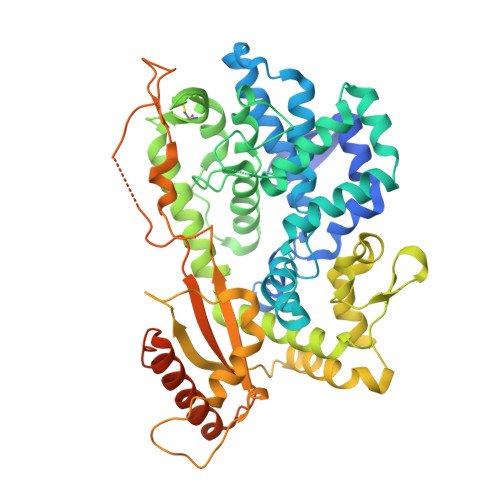 | |
UniProt & NIH Common Fund Data Resources | |||||
Find proteins for Q9Y3Z3 (Homo sapiens) Explore Q9Y3Z3 Go to UniProtKB: Q9Y3Z3 | |||||
PHAROS: Q9Y3Z3 GTEx: ENSG00000101347 | |||||
Entity Groups | |||||
| Sequence Clusters | 30% Identity50% Identity70% Identity90% Identity95% Identity100% Identity | ||||
| UniProt Group | Q9Y3Z3 | ||||
Sequence AnnotationsExpand | |||||
| |||||
| Ligands 2 Unique | |||||
|---|---|---|---|---|---|
| ID | Chains | Name / Formula / InChI Key | 2D Diagram | 3D Interactions | |
| GTP Query on GTP | F [auth A], H [auth B], J [auth C] | GUANOSINE-5'-TRIPHOSPHATE C10 H16 N5 O14 P3 XKMLYUALXHKNFT-UUOKFMHZSA-N |  | ||
| ZN Query on ZN | E [auth A], G [auth B], I [auth C], K [auth D] | ZINC ION Zn PTFCDOFLOPIGGS-UHFFFAOYSA-N |  | ||
| Length ( Å ) | Angle ( ˚ ) |
|---|---|
| a = 80.943 | α = 90 |
| b = 142.765 | β = 90 |
| c = 199.501 | γ = 90 |
| Software Name | Purpose |
|---|---|
| MAR345dtb | data collection |
| PHASES | phasing |
| PHENIX | refinement |
| HKL-2000 | data reduction |
| HKL-2000 | data scaling |
RCSB PDB (citation) is hosted by
RCSB PDB is a member of the

