


Crystal structure of the Kelch domain of human Keap1in complex with ligand S217879
Weber, C., Vuillard, L., Delerive, P., Miallau, L., Nawrotek, A.To be published.
Experimental Data Snapshot
Starting Model: other
View more details
Entity ID: 1 | |||||
|---|---|---|---|---|---|
| Molecule | Chains | Sequence Length | Organism | Details | Image |
| Serine/threonine-protein kinase 3 36kDa subunit | 298 | Homo sapiens | Mutation(s): 0 Gene Names: STK3, KRS1, MST2 EC: 2.7.11.1 | 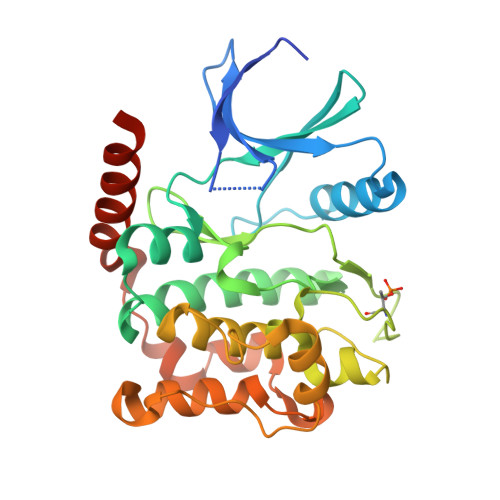 | |
UniProt & NIH Common Fund Data Resources | |||||
PHAROS: Q13188 GTEx: ENSG00000104375 | |||||
Entity Groups | |||||
| Sequence Clusters | 30% Identity50% Identity70% Identity90% Identity95% Identity100% Identity | ||||
| UniProt Group | Q13188 | ||||
Sequence AnnotationsExpand | |||||
Reference Sequence | |||||
Entity ID: 2 | |||||
|---|---|---|---|---|---|
| Molecule | Chains | Sequence Length | Organism | Details | Image |
| Serine/threonine-protein kinase 3 36kDa subunit | 298 | Homo sapiens | Mutation(s): 0 Gene Names: STK3, KRS1, MST2 EC: 2.7.11.1 | 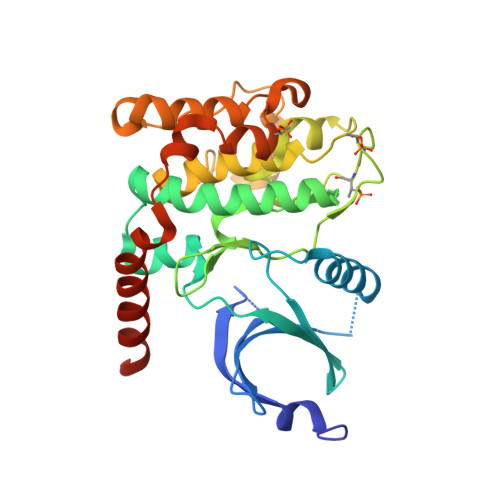 | |
UniProt & NIH Common Fund Data Resources | |||||
PHAROS: Q13188 GTEx: ENSG00000104375 | |||||
Entity Groups | |||||
| Sequence Clusters | 30% Identity50% Identity70% Identity90% Identity95% Identity100% Identity | ||||
| UniProt Group | Q13188 | ||||
Sequence AnnotationsExpand | |||||
Reference Sequence | |||||
| Ligands 2 Unique | |||||
|---|---|---|---|---|---|
| ID | Chains | Name / Formula / InChI Key | 2D Diagram | 3D Interactions | |
| 5BS (Subject of Investigation/LOI) Download:Ideal Coordinates CCD File | C [auth A], F [auth B] | 4-[(5,10-dimethyl-6-oxo-6,10-dihydro-5H-pyrimido[5,4-b]thieno[3,2-e][1,4]diazepin-2-yl)amino]benzenesulfonamide C17 H16 N6 O3 S2 YRDHKIFCGOZTGD-UHFFFAOYSA-N |  | ||
| NA Download:Ideal Coordinates CCD File | D [auth A], E [auth A] | SODIUM ION Na FKNQFGJONOIPTF-UHFFFAOYSA-N |  | ||
| Modified Residues 1 Unique | |||||
|---|---|---|---|---|---|
| ID | Chains | Type | Formula | 2D Diagram | Parent |
| TPO Query on TPO | A | L-PEPTIDE LINKING | C4 H10 N O6 P |  | THR |
| Length ( Å ) | Angle ( ˚ ) |
|---|---|
| a = 90.77 | α = 90 |
| b = 99.04 | β = 90 |
| c = 167.29 | γ = 90 |
| Software Name | Purpose |
|---|---|
| BUSTER | refinement |
| autoPROC | data reduction |
| XSCALE | data scaling |
| PHASER | phasing |
| Funding Organization | Location | Grant Number |
|---|---|---|
| Not funded | -- |


