7U21

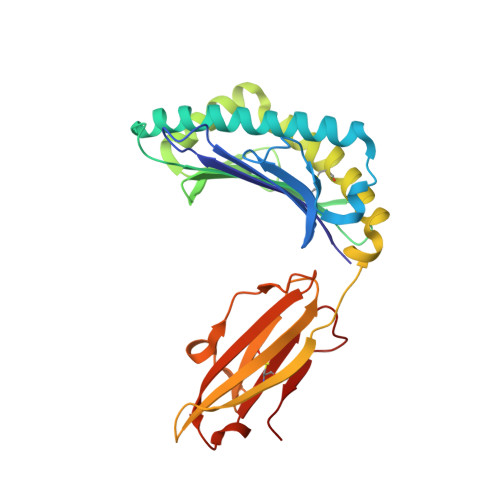
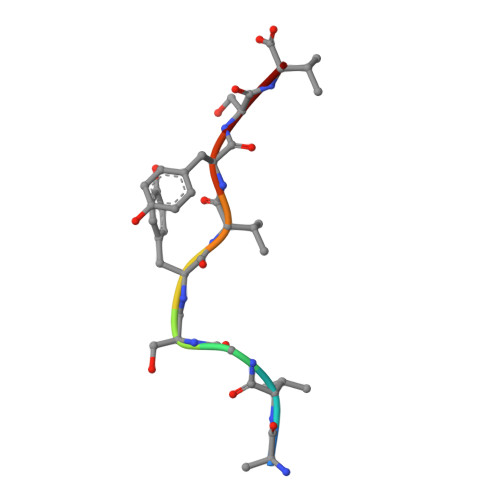
Human Class I MHC HLA-A2 in complex with AVGSYVYSV peptide


Experimental Data Snapshot

  • Method: X-RAY DIFFRACTION
  • Resolution: 1.90 Å
  • R-Value Free: 0.214 
  • R-Value Work: 0.193 
  • R-Value Observed: 0.195 

wwPDB Validation   3D Report Full Report


This is version 1.1 of the entry. See complete history


Literature

Physicochemical Heuristics for Identifying High Fidelity, Near-Native Structural Models of Peptide/MHC Complexes.

Keller, G.L.J.Weiss, L.I.Baker, B.M.

(2022) Front Immunol 13: 887759-887759

  • DOI: https://doi.org/10.3389/fimmu.2022.887759
  • Primary Citation of Related Structures:  
    7U21

  • PubMed Abstract: 

    There is long-standing interest in accurately modeling the structural features of peptides bound and presented by class I MHC proteins. This interest has grown with the advent of rapid genome sequencing and the prospect of personalized, peptide-based cancer vaccines, as well as the development of molecular and cellular therapeutics based on T cell receptor recognition of peptide-MHC. However, while the speed and accessibility of peptide-MHC modeling has improved substantially over the years, improvements in accuracy have been modest. Accuracy is crucial in peptide-MHC modeling, as T cell receptors are highly sensitive to peptide conformation and capturing fine details is therefore necessary for useful models. Studying nonameric peptides presented by the common class I MHC protein HLA-A*02:01, here we addressed a key question common to modern modeling efforts: from a set of models (or decoys) generated through conformational sampling, which is best? We found that the common strategy of decoy selection by lowest energy can lead to substantial errors in predicted structures. We therefore adopted a data-driven approach and trained functions capable of predicting near native decoys with exceptionally high accuracy. Although our implementation is limited to nonamer/HLA-A*02:01 complexes, our results serve as an important proof of concept from which improvements can be made and, given the significance of HLA-A*02:01 and its preference for nonameric peptides, should have immediate utility in select immunotherapeutic and other efforts for which structural information would be advantageous.


  • Organizational Affiliation

    Department of Chemistry & Biochemistry and the Harper Cancer Research Institute, University of Notre Dame, Notre Dame, IN, United States.


Macromolecules
Find similar proteins by:  (by identity cutoff)  |  3D Structure
Entity ID: 1
MoleculeChains Sequence LengthOrganismDetailsImage
MHC class I antigen, A-2 alpha chain
A, D
275Homo sapiensMutation(s): 0 
Gene Names: HLA-A
UniProt
Find proteins for A0A140T913 (Homo sapiens)
Explore A0A140T913 
Go to UniProtKB:  A0A140T913
Entity Groups  
Sequence Clusters30% Identity50% Identity70% Identity90% Identity95% Identity100% Identity
UniProt GroupA0A140T913
Sequence Annotations
Expand
  • Reference Sequence
Find similar proteins by:  (by identity cutoff)  |  3D Structure
Entity ID: 2
MoleculeChains Sequence LengthOrganismDetailsImage
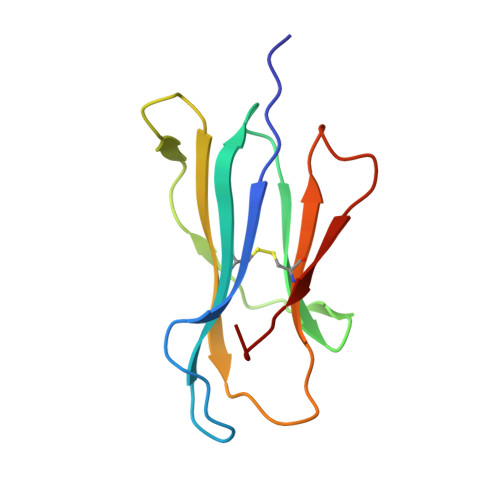
Beta-2-microglobulin
B, E
100Homo sapiensMutation(s): 0 
Gene Names: B2MCDABP0092HDCMA22P
UniProt & NIH Common Fund Data Resources
Find proteins for P61769 (Homo sapiens)
Explore P61769 
Go to UniProtKB:  P61769
PHAROS:  P61769
GTEx:  ENSG00000166710 
Entity Groups  
Sequence Clusters30% Identity50% Identity70% Identity90% Identity95% Identity100% Identity
UniProt GroupP61769
Sequence Annotations
Expand
  • Reference Sequence

Find similar proteins by:  Sequence   |   3D Structure  

Entity ID: 3
MoleculeChains Sequence LengthOrganismDetailsImage
PGM5 peptide (465-473) (H5Y)
C, F
9Homo sapiensMutation(s): 0 
UniProt & NIH Common Fund Data Resources
Find proteins for Q15124 (Homo sapiens)
Explore Q15124 
Go to UniProtKB:  Q15124
PHAROS:  Q15124
GTEx:  ENSG00000154330 
Entity Groups  
UniProt GroupQ15124
Sequence Annotations
Expand
  • Reference Sequence
Experimental Data & Validation

Experimental Data

  • Method: X-RAY DIFFRACTION
  • Resolution: 1.90 Å
  • R-Value Free: 0.214 
  • R-Value Work: 0.193 
  • R-Value Observed: 0.195 
  • Space Group: P 1 21 1
Unit Cell:
Length ( Å )Angle ( ˚ )
a = 58.481α = 90
b = 84.647β = 90
c = 84.323γ = 90
Software Package:
Software NamePurpose
PHENIXrefinement
DIALSdata reduction
HKL-2000data scaling
PHASERphasing

Structure Validation

View Full Validation Report


Entry History & Funding Information

Deposition Data


Funding OrganizationLocationGrant Number
National Institutes of Health/National Cancer Institute (NIH/NCI)United StatesR35GM118166

Revision History  (Full details and data files)

  • Version 1.0: 2022-06-01
    Type: Initial release
  • Version 1.1: 2023-10-18
    Changes: Data collection, Refinement description