7SU9

KRAS-G12D specific TCR9a in complex with C*05-GADGVGKSL


Experimental Data Snapshot

  • Method: X-RAY DIFFRACTION
  • Resolution: 1.99 Å
  • R-Value Free: 0.214 
  • R-Value Work: 0.181 
  • R-Value Observed: 0.183 

wwPDB Validation   3D Report Full Report


This is version 1.1 of the entry. See complete history


Literature

T cells discriminate between groups C1 and C2 HLA-C.

Sim, M.J.W.Stotz, Z.Lu, J.Brennan, P.Long, E.O.Sun, P.D.

(2022) Elife 11

  • DOI: https://doi.org/10.7554/eLife.75670
  • Primary Citation of Related Structures:  
    7SU9

  • PubMed Abstract: 

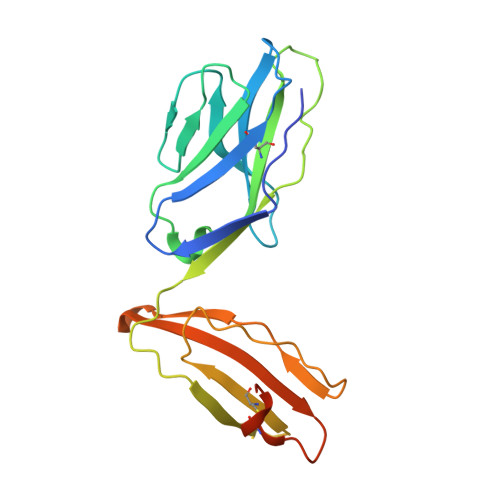
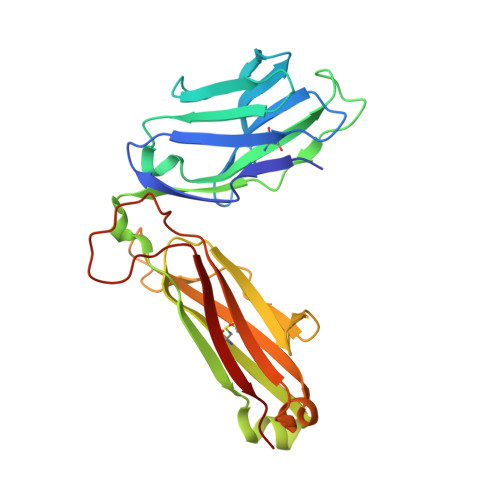
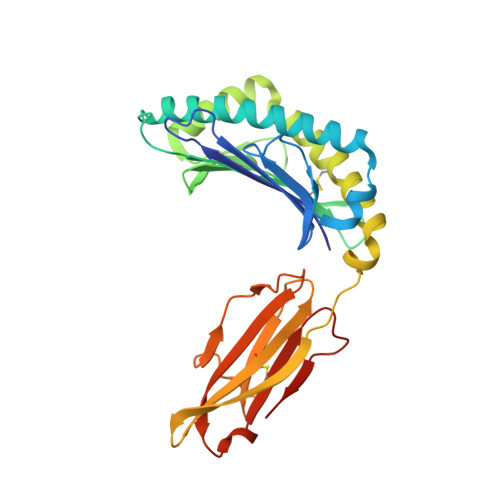
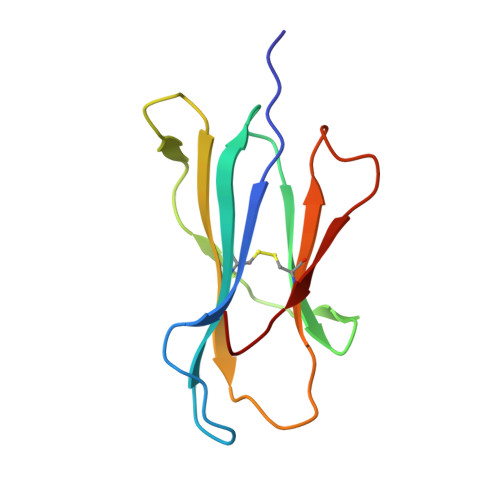
    Dimorphic amino acids at positions 77 and 80 delineate HLA-C allotypes into two groups, C1 and C2, which associate with disease through interactions with C1 and C2-specific natural killer cell receptors. How the C1/C2 dimorphism affects T cell recognition is unknown. Using HLA-C allotypes that differ only by the C1/C2-defining residues, we found that KRAS-G12D neoantigen-specific T cell receptors (TCRs) discriminated between C1 and C2 presenting the same KRAS-G12D peptides. Structural and functional experiments, and immunopeptidomics analysis revealed that Ser77 in C1 and Asn77 in C2 influence amino acid preference near the peptide C-terminus (pΩ), including the pΩ-1 position, in which C1 favors small and C2 prefers large residues. This resulted in weaker TCR affinity for KRAS-G12D-bound C2-HLA-C despite conserved TCR contacts. Thus, the C1/C2 dimorphism on its own impacts peptide presentation and HLA-C-restricted T cell responses, with implications in disease, including adoptive T cell therapy targeting KRAS-G12D-induced cancers.


  • Organizational Affiliation

    Laboratory of Immunogenetics, National Institute of Allergy and Infectious Diseases, National Institutes of Health, Rockville, United States.


Macromolecules
Find similar proteins by:  (by identity cutoff)  |  3D Structure
Entity ID: 1
MoleculeChains Sequence LengthOrganismDetailsImage
TCR9a alpha chainA [auth D]206Homo sapiensMutation(s): 0 
Gene Names: TCRAV
Entity Groups  
Sequence Clusters30% Identity50% Identity70% Identity90% Identity95% Identity100% Identity
Sequence Annotations
Expand
  • Reference Sequence
Find similar proteins by:  (by identity cutoff)  |  3D Structure
Entity ID: 2
MoleculeChains Sequence LengthOrganismDetailsImage
TCR9a beta chainB [auth E]244Homo sapiensMutation(s): 0 
Entity Groups  
Sequence Clusters30% Identity50% Identity70% Identity90% Identity95% Identity100% Identity
Sequence Annotations
Expand
  • Reference Sequence
Find similar proteins by:  (by identity cutoff)  |  3D Structure
Entity ID: 3
MoleculeChains Sequence LengthOrganismDetailsImage
MHC class I antigenC [auth A]280Homo sapiensMutation(s): 0 
Gene Names: HLA-C
UniProt
Find proteins for A2BF26 (Homo sapiens)
Explore A2BF26 
Go to UniProtKB:  A2BF26
Entity Groups  
Sequence Clusters30% Identity50% Identity70% Identity90% Identity95% Identity100% Identity
UniProt GroupA2BF26
Sequence Annotations
Expand
  • Reference Sequence
Find similar proteins by:  (by identity cutoff)  |  3D Structure
Entity ID: 4
MoleculeChains Sequence LengthOrganismDetailsImage
Beta-2-microglobulinD [auth B]100Homo sapiensMutation(s): 0 
Gene Names: B2MCDABP0092HDCMA22P
UniProt & NIH Common Fund Data Resources
Find proteins for P61769 (Homo sapiens)
Explore P61769 
Go to UniProtKB:  P61769
PHAROS:  P61769
GTEx:  ENSG00000166710 
Entity Groups  
Sequence Clusters30% Identity50% Identity70% Identity90% Identity95% Identity100% Identity
UniProt GroupP61769
Sequence Annotations
Expand
  • Reference Sequence

Find similar proteins by:  Sequence   |   3D Structure  

Entity ID: 5
MoleculeChains Sequence LengthOrganismDetailsImage
KRAS-G12D-9mer with A18L substitutionE [auth C]9Homo sapiensMutation(s): 0 
Sequence Annotations
Expand
  • Reference Sequence
Experimental Data & Validation

Experimental Data

  • Method: X-RAY DIFFRACTION
  • Resolution: 1.99 Å
  • R-Value Free: 0.214 
  • R-Value Work: 0.181 
  • R-Value Observed: 0.183 
  • Space Group: P 1 21 1
Unit Cell:
Length ( Å )Angle ( ˚ )
a = 72.716α = 90
b = 74.177β = 101.3
c = 107.389γ = 90
Software Package:
Software NamePurpose
PHENIXrefinement
HKL-2000data reduction
SCALEPACKdata scaling
PHASERphasing
PDB_EXTRACTdata extraction

Structure Validation

View Full Validation Report


Entry History & Funding Information

Deposition Data


Funding OrganizationLocationGrant Number
National Institutes of Health/National Institute Of Allergy and Infectious Diseases (NIH/NIAID)United States1ZIAAI000697-26

Revision History  (Full details and data files)

  • Version 1.0: 2022-06-08
    Type: Initial release
  • Version 1.1: 2023-10-18
    Changes: Data collection, Refinement description