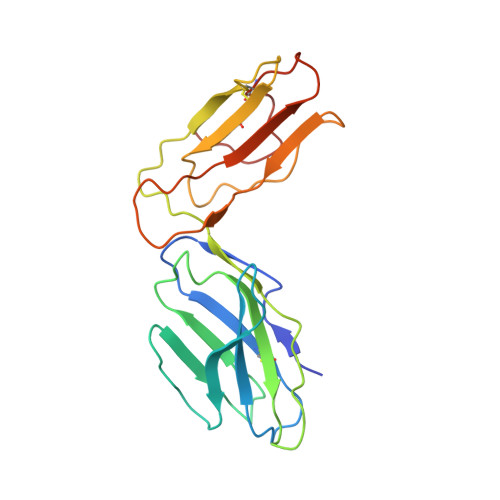
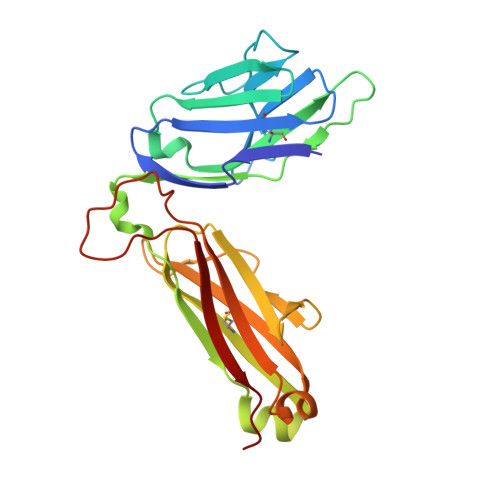
MHC class I-related protein 1 (MR1) is a metabolite-presenting molecule that restricts MR1-reactive T cells including mucosal-associated invariant T (MAIT) cells. In contrast to MAIT cells, the function of other MR1-restricted T cell subsets is largely unknown. Here, we report that mice in which a T cell-specific transcription factor, B-cell lymphoma/leukemia 11B (Bcl11b), was ablated in immature thymocytes (Bcl11b ∆iThy mice) develop chronic inflammation. Bcl11b ∆iThy mice lack conventional T cells and MAIT cells, whereas CD4 + IL-18R + αβ T cells expressing skewed Traj33 (Jα33) + T cell receptors (TCR) accumulate in the periphery, which are necessary and sufficient for the pathogenesis. The disorders observed in Bcl11b ∆iThy mice are ameliorated by MR1-deficiency, transfer of conventional T cells, or germ-free conditions. We further show the crystal structure of the TCR expressed by Traj33 + T cells expanded in Bcl11b ∆iThy mice. Overall, we establish that MR1-reactive T cells have pathogenic potential.
Organizational Affiliation:
Department of Microbiology and Immunology, Graduate School of Medicine, Yamaguchi University, Ube, 755-8505, Japan.
Department of Ophthalmology, Department of Ocular Pathology and Imaging Science, Graduate School of Medical Sciences, Kyushu University, Fukuoka, 812-8582, Japan.
Department of Molecular Immunology, Research Institute for Microbial Diseases, Osaka University, Suita, 565-0871, Japan.
Division of Infection and Immunity, Joint Research Center for Human Retrovirus Infection, Kumamoto University, Kumamoto, 860-0871, Japan.
Laboratory of Molecular Immunology, Immunology Frontier Research Center, Osaka University, Suita, 565-0871, Japan.
Department of Infection Metagenomics, Genome Information Research Center, Research Institute for Microbial Diseases, Osaka University, Suita, 565-0871, Japan.
Single Cell Genomics, Human Immunology, World Premier International Research Center Initiative Immunology Frontier Research Center, Osaka University, Suita, 565-0871, Japan.
Genome Information Research Center, Research Institute for Microbial Diseases, Osaka University, Suita, 565-0871, Japan.
Division of Metabolomics, Medical Institute of Bioregulation, Kyushu University, Fukuoka, 812-8582, Japan.
Department of Medicine and Bioregulatory Science, Graduate School of Medical Sciences, Kyushu University, Fukuoka, 812-8582, Japan.
Laboratory of Human Immunology (Single Cell Immunology), World Premier International Immunology Frontier Research Center, Osaka University, Suita, 565-0871, Japan.
Laboratory of Experimental Immunology, World Premier International Immunology Frontier Research Center, Osaka University, Suita, 565-0871, Japan.
Department of Systems Bioinformatics, Graduate School of Medicine, Yamaguchi University, Ube, 755-8505, Japan.
Japan Agency for Medical Research and Development, Core Research for Evolutional Science and Technology, Tokyo, 100-0004, Japan.
Department of Molecular Medicine and Metabolism, Research Institute of Environmental Medicine, Nagoya University, Nagoya, 464-8601, Japan.
Systems Biochemistry in Pathology and Regeneration, Graduate School of Medicine, Yamaguchi University, Ube, 755-8505, Japan.
Department of Molecular Immunology, Research Institute for Microbial Diseases, Osaka University, Suita, 565-0871, Japan. yamasaki@biken.osaka-u.ac.jp.
Laboratory of Molecular Immunology, Immunology Frontier Research Center, Osaka University, Suita, 565-0871, Japan. yamasaki@biken.osaka-u.ac.jp.
Division of Molecular Design, Medical Institute of Bioregulation, Kyushu University, Fukuoka, 812-8582, Japan. yamasaki@biken.osaka-u.ac.jp.
Division of Molecular Immunology, Medical Mycology Research Center, Chiba University, Chiba, 260-8673, Japan. yamasaki@biken.osaka-u.ac.jp.