6UTM

Native E. coli Glyceraldehyde 3-phosphate dehydrogenase


Experimental Data Snapshot

  • Method: X-RAY DIFFRACTION
  • Resolution: 2.14 Å
  • R-Value Free: 0.199 
  • R-Value Work: 0.161 
  • R-Value Observed: 0.161 

wwPDB Validation   3D Report Full Report


Ligand Structure Quality Assessment 


This is version 1.1 of the entry. See complete history


Literature

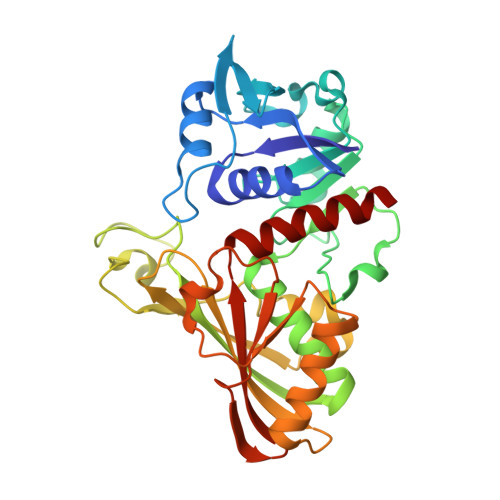
A Novel Substrate-Binding Site in the X-Ray Structure of an Oxidized E. coli Glyceraldehyde 3-Phosphate Dehydrogenase Elucidated by Single-Wavelength Anomalous Dispersion

Rodriguez-Hernandez, A.Romo-Arevalo, E.Rodriguez-Romero, A.

(2019) Crystals (Basel) 9: 622


Macromolecules
Find similar proteins by:  (by identity cutoff)  |  3D Structure
Entity ID: 1
MoleculeChains Sequence LengthOrganismDetailsImage
Glyceraldehyde-3-phosphate dehydrogenase
A, B
330Escherichia coliMutation(s): 0 
Gene Names: gapAACN002_1253
EC: 1.2.1
UniProt
Find proteins for P0A9B2 (Escherichia coli (strain K12))
Explore P0A9B2 
Go to UniProtKB:  P0A9B2
Entity Groups  
Sequence Clusters30% Identity50% Identity70% Identity90% Identity95% Identity100% Identity
UniProt GroupP0A9B2
Sequence Annotations
Expand
  • Reference Sequence
Experimental Data & Validation

Experimental Data

  • Method: X-RAY DIFFRACTION
  • Resolution: 2.14 Å
  • R-Value Free: 0.199 
  • R-Value Work: 0.161 
  • R-Value Observed: 0.161 
  • Space Group: C 2 2 21
Unit Cell:
Length ( Å )Angle ( ˚ )
a = 77.912α = 90
b = 186.966β = 90
c = 121.751γ = 90
Software Package:
Software NamePurpose
PHENIXrefinement
PHENIXrefinement
HKL-3000data reduction
HKL-3000data scaling
PHASERphasing

Structure Validation

View Full Validation Report


Ligand Structure Quality Assessment 


Entry History 

Deposition Data

Revision History  (Full details and data files)

  • Version 1.0: 2019-12-11
    Type: Initial release
  • Version 1.1: 2024-03-06
    Changes: Data collection, Database references, Derived calculations, Refinement description