DNA mismatches reveal conformational penalties in protein-DNA recognition.
Afek, A., Shi, H., Rangadurai, A., Sahay, H., Senitzki, A., Xhani, S., Fang, M., Salinas, R., Mielko, Z., Pufall, M.A., Poon, G.M.K., Haran, T.E., Schumacher, M.A., Al-Hashimi, H.M., Gordan, R.(2020) Nature 587: 291-296
- PubMed: 33087930
- DOI: https://doi.org/10.1038/s41586-020-2843-2
- Primary Citation of Related Structures:
6UEO, 6UEP, 6UEQ, 6UER - PubMed Abstract:
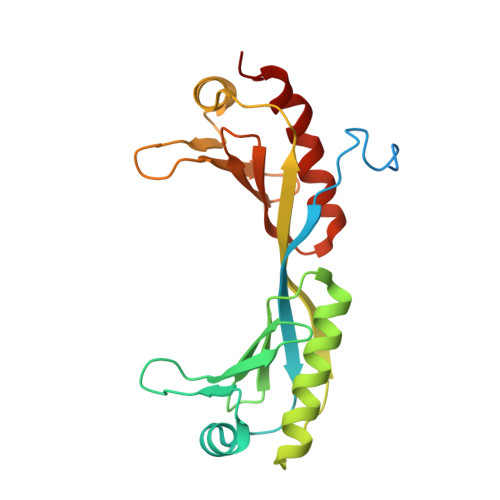
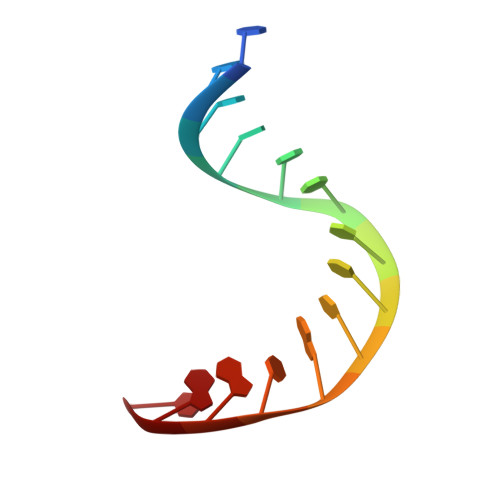
Transcription factors recognize specific genomic sequences to regulate complex gene-expression programs. Although it is well-established that transcription factors bind to specific DNA sequences using a combination of base readout and shape recognition, some fundamental aspects of protein-DNA binding remain poorly understood 1,2 . Many DNA-binding proteins induce changes in the structure of the DNA outside the intrinsic B-DNA envelope. However, how the energetic cost that is associated with distorting the DNA contributes to recognition has proven difficult to study, because the distorted DNA exists in low abundance in the unbound ensemble 3-9 . Here we use a high-throughput assay that we term SaMBA (saturation mismatch-binding assay) to investigate the role of DNA conformational penalties in transcription factor-DNA recognition. In SaMBA, mismatched base pairs are introduced to pre-induce structural distortions in the DNA that are much larger than those induced by changes in the Watson-Crick sequence. Notably, approximately 10% of mismatches increased transcription factor binding, and for each of the 22 transcription factors that were examined, at least one mismatch was found that increased the binding affinity. Mismatches also converted non-specific sites into high-affinity sites, and high-affinity sites into 'super sites' that exhibit stronger affinity than any known canonical binding site. Determination of high-resolution X-ray structures, combined with nuclear magnetic resonance measurements and structural analyses, showed that many of the DNA mismatches that increase binding induce distortions that are similar to those induced by protein binding-thus prepaying some of the energetic cost incurred from deforming the DNA. Our work indicates that conformational penalties are a major determinant of protein-DNA recognition, and reveals mechanisms by which mismatches can recruit transcription factors and thus modulate replication and repair activities in the cell 10,11 .
- Center for Genomic and Computational Biology, Duke University School of Medicine, Durham, NC, USA.
Organizational Affiliation:


