6PX6

HLA-TCR complex


Experimental Data Snapshot

  • Method: X-RAY DIFFRACTION
  • Resolution: 3.00 Å
  • R-Value Free: 0.257 
  • R-Value Work: 0.205 
  • R-Value Observed: 0.208 

wwPDB Validation   3D Report Full Report


This is version 1.4 of the entry. See complete history


Literature

A molecular basis for the T cell response in HLA-DQ2.2 mediated celiac disease.

Ting, Y.T.Dahal-Koirala, S.Kim, H.S.K.Qiao, S.W.Neumann, R.S.Lundin, K.E.A.Petersen, J.Reid, H.H.Sollid, L.M.Rossjohn, J.

(2020) Proc Natl Acad Sci U S A 117: 3063-3073

  • DOI: https://doi.org/10.1073/pnas.1914308117
  • Primary Citation of Related Structures:  
    6PX6, 6PY2

  • PubMed Abstract: 

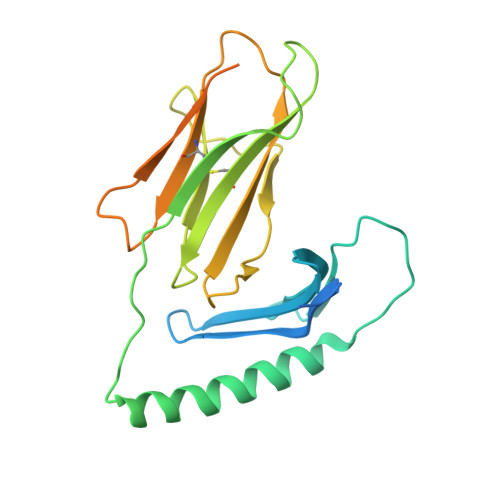
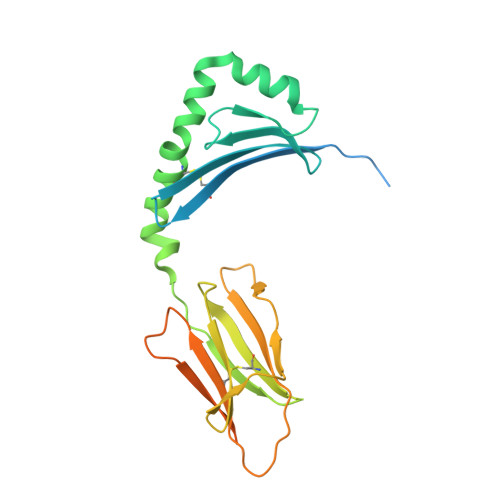
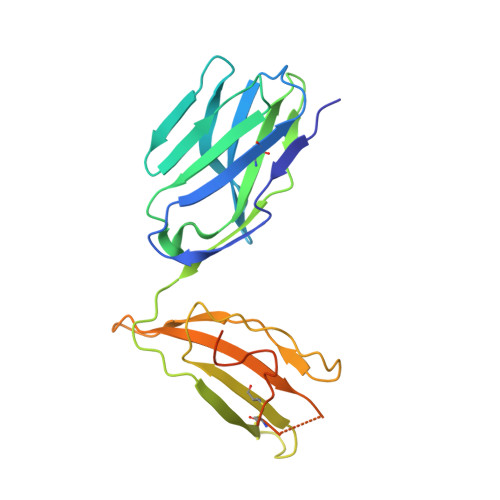
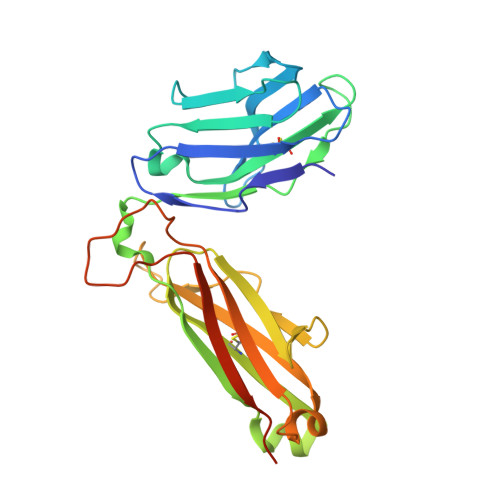
    The highly homologous human leukocyte antigen (HLA)-DQ2 molecules, HLA-DQ2.5 and HLA-DQ2.2, are implicated in the pathogenesis of celiac disease (CeD) by presenting gluten peptides to CD4 + T cells. However, while HLA-DQ2.5 is strongly associated with disease, HLA-DQ2.2 is not, and the molecular basis underpinning this differential disease association is unresolved. We here provide structural evidence for how the single polymorphic residue (HLA-DQ2.5-Tyr22α and HLA-DQ2.2-Phe22α) accounts for HLA-DQ2.2 additionally requiring gluten epitopes possessing a serine at the P3 position of the peptide. In marked contrast to the biased T cell receptor (TCR) usage associated with HLA-DQ2.5-mediated CeD, we demonstrate with extensive single-cell sequencing that a diverse TCR repertoire enables recognition of the immunodominant HLA-DQ2.2-glut-L1 epitope. The crystal structure of two CeD patient-derived TCR in complex with HLA-DQ2.2 and DQ2.2-glut-L1 (PFSEQEQPV) revealed a docking strategy, and associated interatomic contacts, which was notably distinct from the structures of the TCR:HLA-DQ2.5:gliadin epitope complexes. Accordingly, while the molecular surfaces of the antigen-binding clefts of HLA-DQ2.5 and HLA-DQ2.2 are very similar, differences in the nature of the peptides presented translates to differences in responding T cell repertoires and the nature of engagement of the respective antigen-presenting molecules, which ultimately is associated with differing disease penetrance.


  • Organizational Affiliation

    Infection and Immunity Program, Biomedicine Discovery Institute, Monash University, Clayton, VIC 3800, Australia.


Macromolecules
Find similar proteins by:  (by identity cutoff)  |  3D Structure
Entity ID: 1
MoleculeChains Sequence LengthOrganismDetailsImage
HLA class II histocompatibility antigen DQ alpha chain254Homo sapiensMutation(s): 0 
Gene Names: HLA-DQA1
UniProt
Find proteins for Q08AS3 (Homo sapiens)
Explore Q08AS3 
Go to UniProtKB:  Q08AS3
Entity Groups  
Sequence Clusters30% Identity50% Identity70% Identity90% Identity95% Identity100% Identity
UniProt GroupQ08AS3
Sequence Annotations
Expand
  • Reference Sequence
Find similar proteins by:  (by identity cutoff)  |  3D Structure
Entity ID: 2
MoleculeChains Sequence LengthOrganismDetailsImage
HLA class II histocompatibility antigen DQ beta chain261Homo sapiensMutation(s): 0 
Gene Names: HLA-DQB1
UniProt
Find proteins for A0A0U5IHY9 (Homo sapiens)
Explore A0A0U5IHY9 
Go to UniProtKB:  A0A0U5IHY9
Entity Groups  
Sequence Clusters30% Identity50% Identity70% Identity90% Identity95% Identity100% Identity
UniProt GroupA0A0U5IHY9
Sequence Annotations
Expand
  • Reference Sequence

Find similar proteins by:  Sequence   |   3D Structure  

Entity ID: 3
MoleculeChains Sequence LengthOrganismDetailsImage
DQ2.2-glut-L112Triticum aestivumMutation(s): 0 
UniProt
Find proteins for P16315 (Triticum aestivum)
Explore P16315 
Go to UniProtKB:  P16315
Entity Groups  
Sequence Clusters30% Identity50% Identity70% Identity90% Identity95% Identity100% Identity
UniProt GroupP16315
Sequence Annotations
Expand
  • Reference Sequence
Find similar proteins by:  (by identity cutoff)  |  3D Structure
Entity ID: 4
MoleculeChains Sequence LengthOrganismDetailsImage
T-cell receptor, T1005.2.56, alpha chain,Human nkt tcr alpha chain217Homo sapiensMutation(s): 0 
UniProt
Find proteins for K7N5M3 (Homo sapiens)
Explore K7N5M3 
Go to UniProtKB:  K7N5M3
Entity Groups  
Sequence Clusters30% Identity50% Identity70% Identity90% Identity95% Identity100% Identity
UniProt GroupK7N5M3
Sequence Annotations
Expand
  • Reference Sequence
Find similar proteins by:  (by identity cutoff)  |  3D Structure
Entity ID: 5
MoleculeChains Sequence LengthOrganismDetailsImage
T-cell receptor, T1005.2.56, beta chain256Homo sapiensMutation(s): 0 
Entity Groups  
Sequence Clusters30% Identity50% Identity70% Identity90% Identity95% Identity100% Identity
Sequence Annotations
Expand
  • Reference Sequence
Experimental Data & Validation

Experimental Data

  • Method: X-RAY DIFFRACTION
  • Resolution: 3.00 Å
  • R-Value Free: 0.257 
  • R-Value Work: 0.205 
  • R-Value Observed: 0.208 
  • Space Group: P 1 21 1
Unit Cell:
Length ( Å )Angle ( ˚ )
a = 72.534α = 90
b = 99.416β = 118.264
c = 72.565γ = 90
Software Package:
Software NamePurpose
PHENIXrefinement
XDSdata reduction
Aimlessdata scaling
PHASERphasing

Structure Validation

View Full Validation Report


Entry History 

Deposition Data

Revision History  (Full details and data files)

  • Version 1.0: 2020-01-15
    Type: Initial release
  • Version 1.1: 2020-01-22
    Changes: Database references
  • Version 1.2: 2020-02-05
    Changes: Database references
  • Version 1.3: 2020-02-26
    Changes: Database references
  • Version 1.4: 2023-10-11
    Changes: Data collection, Database references, Refinement description