TCR-induced alteration of primary MHC peptide anchor residue.
Madura, F., Rizkallah, P.J., Legut, M., Holland, C.J., Fuller, A., Bulek, A., Schauenburg, A.J., Trimby, A., Hopkins, J.R., Wells, S.A., Godkin, A., Miles, J.J., Sami, M., Li, Y., Liddy, N., Jakobsen, B.K., Loveridge, E.J., Cole, D.K., Sewell, A.K.(2019) Eur J Immunol 49: 1052-1066
- PubMed: 31091334 Search on PubMedSearch on PubMed Central
- DOI: https://doi.org/10.1002/eji.201948085
- Primary Citation Related Structures:
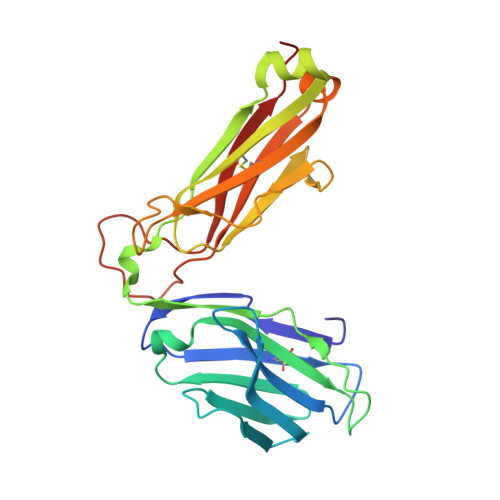
6EQA, 6EQB - PubMed Abstract:
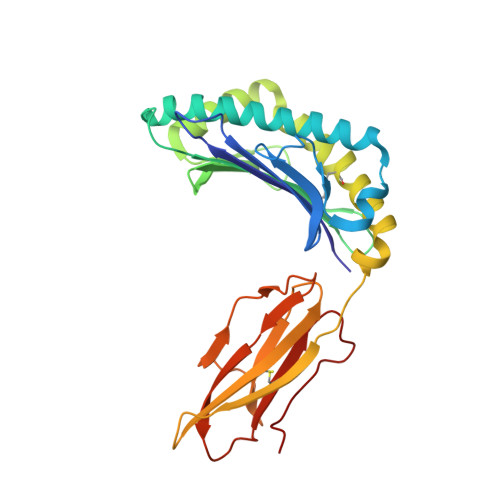
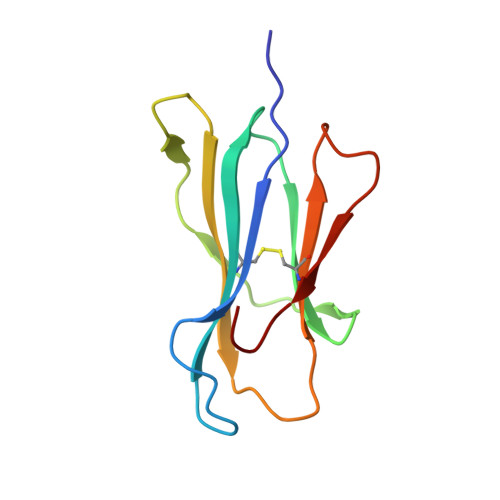
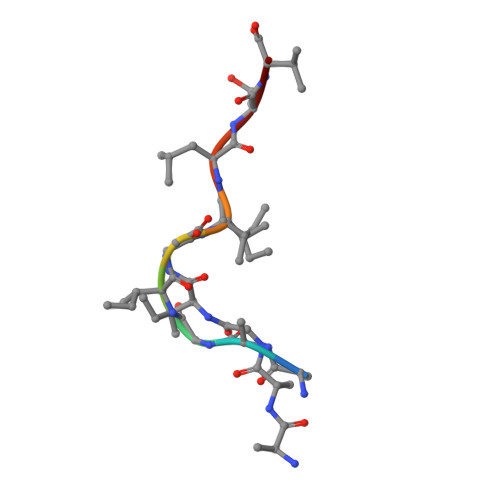
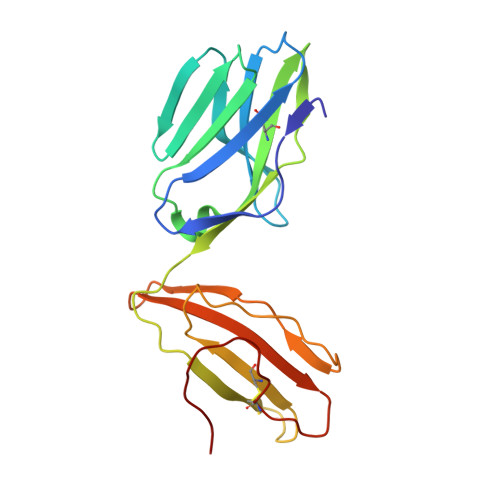
The HLA-A*02:01-restricted decapeptide EAAGIGILTV, derived from melanoma antigen recognized by T-cells-1 (MART-1) protein, represents one of the best-studied tumor associated T-cell epitopes, but clinical results targeting this peptide have been disappointing. This limitation may reflect the dominance of the nonapeptide, AAGIGILTV, at the melanoma cell surface. The decapeptide and nonapeptide are presented in distinct conformations by HLA-A*02:01 and TCRs from clinically relevant T-cell clones recognize the nonapeptide poorly. Here, we studied the MEL5 TCR that potently recognizes the nonapeptide. The structure of the MEL5-HLA-A*02:01-AAGIGILTV complex revealed an induced fit mechanism of antigen recognition involving altered peptide-MHC anchoring. This "flexing" at the TCR-peptide-MHC interface to accommodate the peptide antigen explains previously observed incongruences in this well-studied system and has important implications for future therapeutic approaches. Finally, this study expands upon the mechanisms by which molecular plasticity can influence antigen recognition by T cells.
- School of Medicine, Cardiff University, Cardiff, UK.
Organizational Affiliation: