


Structural Basis for Specific Inhibition of tRNA Synthetase by ATP Competitive Inhibitor
Fang, P., Han, H., Wang, J., Chen, K., Chen, X., Guo, M.(2015) Chem Biol 22: 1
Experimental Data Snapshot
Starting Model: experimental
View more details
Entity ID: 1 | |||||
|---|---|---|---|---|---|
| Molecule | Chains | Sequence Length | Organism | Details | Image |
| Lysine--tRNA ligase | 513 | Homo sapiens | Mutation(s): 0 Gene Names: KARS, KIAA0070 EC: 6.1.1.6 (PDB Primary Data), 2.7.7 (UniProt) | 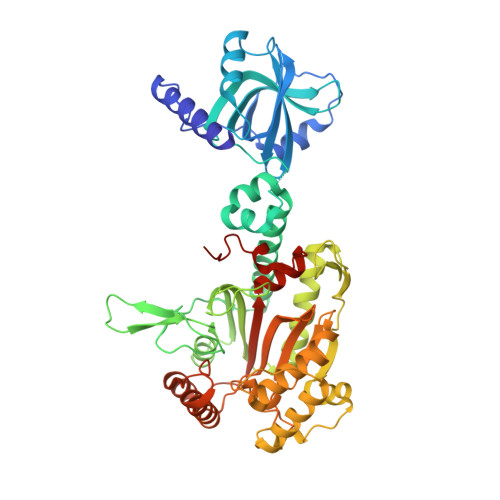 | |
UniProt & NIH Common Fund Data Resources | |||||
PHAROS: Q15046 GTEx: ENSG00000065427 | |||||
Entity Groups | |||||
| Sequence Clusters | 30% Identity50% Identity70% Identity90% Identity95% Identity100% Identity | ||||
| UniProt Group | Q15046 | ||||
Sequence AnnotationsExpand | |||||
Reference Sequence | |||||
Entity ID: 2 | |||||
|---|---|---|---|---|---|
| Molecule | Chains | Sequence Length | Organism | Details | Image |
| Aminoacyl tRNA synthase complex-interacting multifunctional protein 2 | 42 | Homo sapiens | Mutation(s): 0 Gene Names: AIMP2, JTV1, PRO0992 | 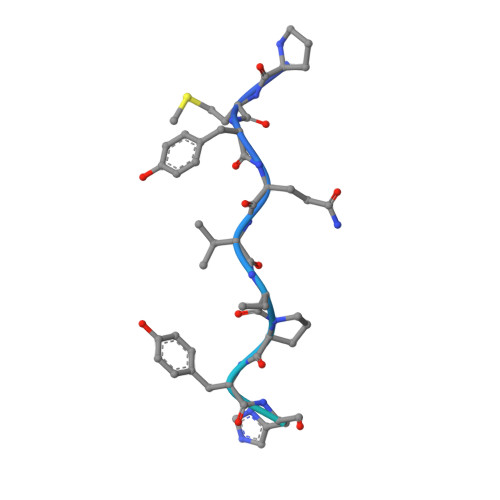 | |
UniProt & NIH Common Fund Data Resources | |||||
PHAROS: Q13155 GTEx: ENSG00000106305 | |||||
Entity Groups | |||||
| Sequence Clusters | 30% Identity50% Identity70% Identity90% Identity95% Identity100% Identity | ||||
| UniProt Group | Q13155 | ||||
Sequence AnnotationsExpand | |||||
Reference Sequence | |||||
| Ligands 2 Unique | |||||
|---|---|---|---|---|---|
| ID | Chains | Name / Formula / InChI Key | 2D Diagram | 3D Interactions | |
| KRS Download:Ideal Coordinates CCD File | J [auth A], L [auth B], N [auth E], P [auth F] | cladosporin C16 H20 O5 WOMKDMUZNBFXKG-ZWKOPEQDSA-N |  | ||
| LYS Download:Ideal Coordinates CCD File | I [auth A], K [auth B], M [auth E], O [auth F] | LYSINE C6 H15 N2 O2 KDXKERNSBIXSRK-YFKPBYRVSA-O |  | ||
| Length ( Å ) | Angle ( ˚ ) |
|---|---|
| a = 51.283 | α = 90.8 |
| b = 75.561 | β = 99.09 |
| c = 162.987 | γ = 109.83 |
| Software Name | Purpose |
|---|---|
| PHENIX | refinement |
| HKL-2000 | data scaling |
| PDB_EXTRACT | data extraction |
| HKL-2000 | data reduction |
| MOLREP | phasing |
| Funding Organization | Location | Grant Number |
|---|---|---|
| National Institutes of Health/National Institute of General Medical Sciences (NIH/NIGMS) | United States | GM100136 |
| National Institutes of Health/National Institute of General Medical Sciences (NIH/NIGMS) | United States | GM106134 |


