4X6C

CD1a ternary complex with lysophosphatidylcholine and BK6 TCR


Experimental Data Snapshot

  • Method: X-RAY DIFFRACTION
  • Resolution: 2.80 Å
  • R-Value Free: 0.236 
  • R-Value Work: 0.176 
  • R-Value Observed: 0.178 

wwPDB Validation   3D Report Full Report


Ligand Structure Quality Assessment 


This is version 1.5 of the entry. See complete history


Literature

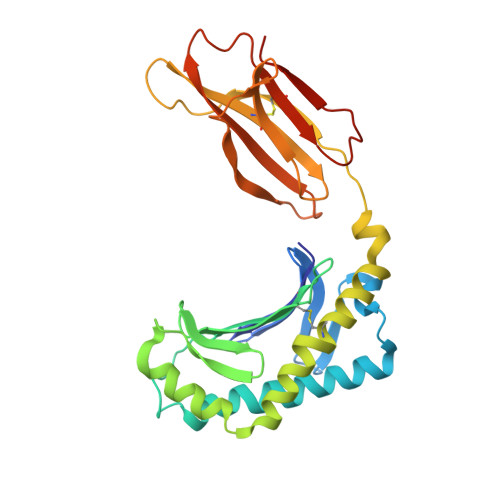
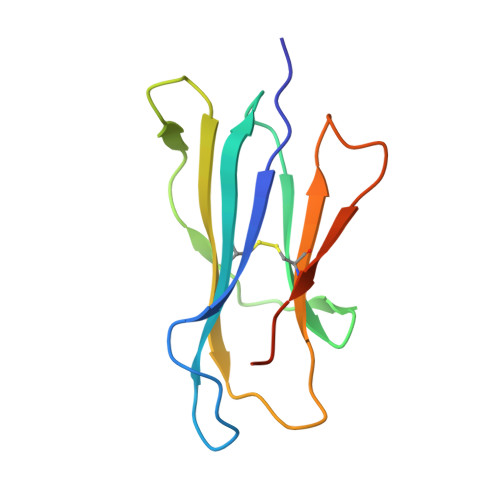
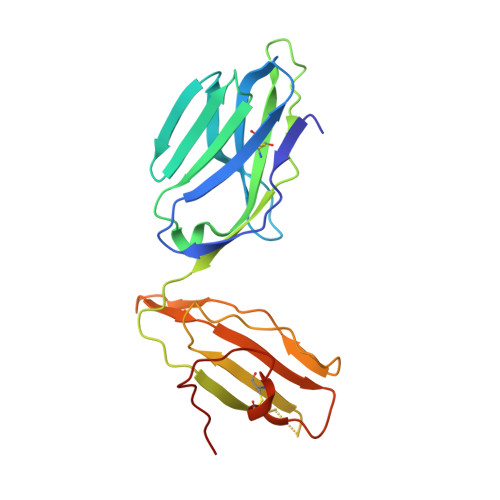
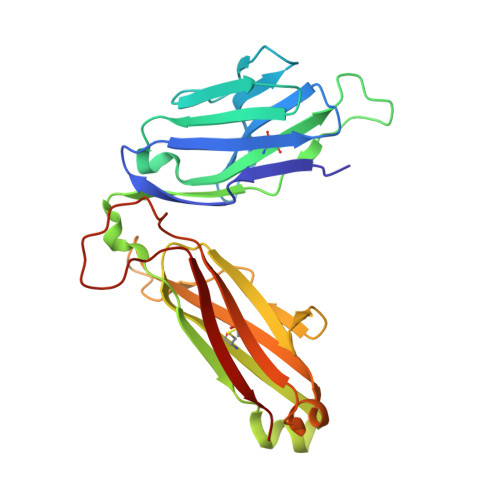
alpha beta T cell antigen receptor recognition of CD1a presenting self lipid ligands.

Birkinshaw, R.W.Pellicci, D.G.Cheng, T.Y.Keller, A.N.Sandoval-Romero, M.Gras, S.de Jong, A.Uldrich, A.P.Moody, D.B.Godfrey, D.I.Rossjohn, J.

(2015) Nat Immunol 16: 258-266

  • DOI: https://doi.org/10.1038/ni.3098
  • Primary Citation of Related Structures:  
    4X6B, 4X6C, 4X6D, 4X6E, 4X6F

  • PubMed Abstract: 

    A central paradigm in αβ T cell-mediated immunity is the simultaneous co-recognition of antigens and antigen-presenting molecules by the αβ T cell antigen receptor (TCR). CD1a presents a broad repertoire of lipid-based antigens. We found that a prototypical autoreactive TCR bound CD1a when it was presenting a series of permissive endogenous ligands, while other lipid ligands were nonpermissive to TCR binding. The structures of two TCR-CD1a-lipid complexes showed that the TCR docked over the A' roof of CD1a in a manner that precluded direct contact with permissive ligands. Nonpermissive ligands indirectly inhibited TCR binding by disrupting the TCR-CD1a contact zone. The exclusive recognition of CD1a by the TCR represents a previously unknown mechanism whereby αβ T cells indirectly sense self antigens that are bound to an antigen-presenting molecule.


  • Organizational Affiliation

    1] Department of Biochemistry and Molecular Biology, School of Biomedical Sciences, Monash University, Clayton, Australia. [2] ARC Centre of Excellence in Advanced Molecular Imaging, Monash University, Clayton, Australia.


Macromolecules
Find similar proteins by:  (by identity cutoff)  |  3D Structure
Entity ID: 1
MoleculeChains Sequence LengthOrganismDetailsImage
T-cell surface glycoprotein CD1a
A, C
281Homo sapiensMutation(s): 2 
Gene Names: CD1A
UniProt & NIH Common Fund Data Resources
Find proteins for P06126 (Homo sapiens)
Explore P06126 
Go to UniProtKB:  P06126
PHAROS:  P06126
GTEx:  ENSG00000158477 
Entity Groups  
Sequence Clusters30% Identity50% Identity70% Identity90% Identity95% Identity100% Identity
UniProt GroupP06126
Sequence Annotations
Expand
  • Reference Sequence
Find similar proteins by:  (by identity cutoff)  |  3D Structure
Entity ID: 2
MoleculeChains Sequence LengthOrganismDetailsImage
Beta-2-microglobulin
B, D
105Homo sapiensMutation(s): 0 
Gene Names: B2MCDABP0092HDCMA22P
UniProt & NIH Common Fund Data Resources
Find proteins for P61769 (Homo sapiens)
Explore P61769 
Go to UniProtKB:  P61769
PHAROS:  P61769
GTEx:  ENSG00000166710 
Entity Groups  
Sequence Clusters30% Identity50% Identity70% Identity90% Identity95% Identity100% Identity
UniProt GroupP61769
Sequence Annotations
Expand
  • Reference Sequence
Find similar proteins by:  (by identity cutoff)  |  3D Structure
Entity ID: 3
MoleculeChains Sequence LengthOrganismDetailsImage
TCR alpha
E, G
207Homo sapiensMutation(s): 0 
UniProt & NIH Common Fund Data Resources
Find proteins for P01848 (Homo sapiens)
Explore P01848 
Go to UniProtKB:  P01848
PHAROS:  P01848
Entity Groups  
Sequence Clusters30% Identity50% Identity70% Identity90% Identity95% Identity100% Identity
UniProt GroupP01848
Sequence Annotations
Expand
  • Reference Sequence
Find similar proteins by:  (by identity cutoff)  |  3D Structure
Entity ID: 4
MoleculeChains Sequence LengthOrganismDetailsImage
TCR beta
F, H
245Homo sapiensMutation(s): 0 
UniProt
Find proteins for P01850 (Homo sapiens)
Explore P01850 
Go to UniProtKB:  P01850
Entity Groups  
Sequence Clusters30% Identity50% Identity70% Identity90% Identity95% Identity100% Identity
UniProt GroupP01850
Sequence Annotations
Expand
  • Reference Sequence
Experimental Data & Validation

Experimental Data

  • Method: X-RAY DIFFRACTION
  • Resolution: 2.80 Å
  • R-Value Free: 0.236 
  • R-Value Work: 0.176 
  • R-Value Observed: 0.178 
  • Space Group: P 21 21 21
Unit Cell:
Length ( Å )Angle ( ˚ )
a = 89.273α = 90
b = 142.144β = 90
c = 175.752γ = 90
Software Package:
Software NamePurpose
PHENIXrefinement
iMOSFLMdata reduction
Aimlessdata scaling

Structure Validation

View Full Validation Report


Ligand Structure Quality Assessment 


Entry History 

Deposition Data

Revision History  (Full details and data files)

  • Version 1.0: 2015-01-28
    Type: Initial release
  • Version 1.1: 2015-02-18
    Changes: Database references
  • Version 1.2: 2015-02-25
    Changes: Database references
  • Version 1.3: 2015-03-04
    Changes: Structure summary
  • Version 1.4: 2020-07-29
    Type: Remediation
    Reason: Carbohydrate remediation
    Changes: Data collection, Derived calculations, Source and taxonomy, Structure summary
  • Version 1.5: 2023-09-27
    Changes: Data collection, Database references, Refinement description, Structure summary