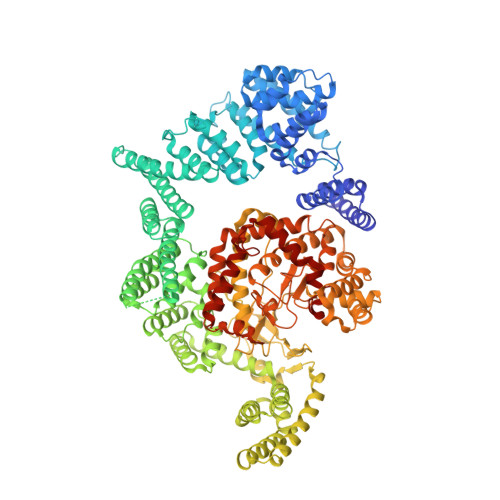
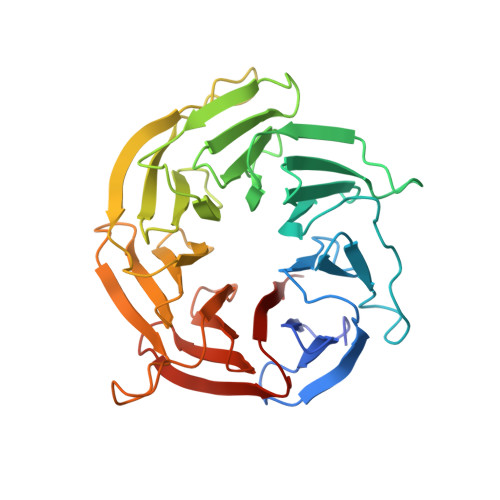
4JT6

structure of mTORDeltaN-mLST8-PI-103 complex


Experimental Data Snapshot

  • Method: X-RAY DIFFRACTION
  • Resolution: 3.60 Å
  • R-Value Free: 0.275 
  • R-Value Work: 0.239 
  • R-Value Observed: 0.240 

wwPDB Validation   3D Report Full Report


Ligand Structure Quality Assessment 


This is version 1.2 of the entry. See complete history


Literature

mTOR kinase structure, mechanism and regulation.

Yang, H.Rudge, D.G.Koos, J.D.Vaidialingam, B.Yang, H.J.Pavletich, N.P.

(2013) Nature 497: 217-223

  • DOI: https://doi.org/10.1038/nature12122
  • Primary Citation of Related Structures:  
    4JSN, 4JSP, 4JSV, 4JSX, 4JT5, 4JT6

  • PubMed Abstract: 

    The mammalian target of rapamycin (mTOR), a phosphoinositide 3-kinase-related protein kinase, controls cell growth in response to nutrients and growth factors and is frequently deregulated in cancer. Here we report co-crystal structures of a complex of truncated mTOR and mammalian lethal with SEC13 protein 8 (mLST8) with an ATP transition state mimic and with ATP-site inhibitors. The structures reveal an intrinsically active kinase conformation, with catalytic residues and a catalytic mechanism remarkably similar to canonical protein kinases. The active site is highly recessed owing to the FKBP12-rapamycin-binding (FRB) domain and an inhibitory helix protruding from the catalytic cleft. mTOR-activating mutations map to the structural framework that holds these elements in place, indicating that the kinase is controlled by restricted access. In vitro biochemistry shows that the FRB domain acts as a gatekeeper, with its rapamycin-binding site interacting with substrates to grant them access to the restricted active site. Rapamycin-FKBP12 inhibits the kinase by directly blocking substrate recruitment and by further restricting active-site access. The structures also reveal active-site residues and conformational changes that underlie inhibitor potency and specificity.


  • Organizational Affiliation

    Structural Biology Program, Memorial Sloan-Kettering Cancer Center, New York, New York 10065, USA.


Macromolecules
Find similar proteins by:  (by identity cutoff)  |  3D Structure
Entity ID: 1
MoleculeChains Sequence LengthOrganismDetailsImage
mTORA [auth B],
C [auth A]
1,174Homo sapiensMutation(s): 0 
Gene Names: mTOR
UniProt & NIH Common Fund Data Resources
Find proteins for P42345 (Homo sapiens)
Explore P42345 
Go to UniProtKB:  P42345
PHAROS:  P42345
GTEx:  ENSG00000198793 
Entity Groups  
Sequence Clusters30% Identity50% Identity70% Identity90% Identity95% Identity100% Identity
UniProt GroupP42345
Sequence Annotations
Expand
  • Reference Sequence
Find similar proteins by:  (by identity cutoff)  |  3D Structure
Entity ID: 2
MoleculeChains Sequence LengthOrganismDetailsImage
mLST8B [auth D],
D [auth C]
326Homo sapiensMutation(s): 0 
Gene Names: mLST8
UniProt & NIH Common Fund Data Resources
Find proteins for Q9BVC4 (Homo sapiens)
Explore Q9BVC4 
Go to UniProtKB:  Q9BVC4
PHAROS:  Q9BVC4
GTEx:  ENSG00000167965 
Entity Groups  
Sequence Clusters30% Identity50% Identity70% Identity90% Identity95% Identity100% Identity
UniProt GroupQ9BVC4
Sequence Annotations
Expand
  • Reference Sequence
Small Molecules
Ligands 1 Unique
IDChains Name / Formula / InChI Key2D Diagram3D Interactions
X6K
Query on X6K

Download Ideal Coordinates CCD File 
E [auth B],
F [auth A]
3-(4-MORPHOLIN-4-YLPYRIDO[3',2':4,5]FURO[3,2-D]PYRIMIDIN-2-YL)PHENOL
C19 H16 N4 O3
TUVCWJQQGGETHL-UHFFFAOYSA-N
Binding Affinity Annotations 
IDSourceBinding Affinity
X6K BindingDB:  4JT6 Ki: min: 19, max: 20 (nM) from 2 assay(s)
Kd: 12 (nM) from 1 assay(s)
IC50: min: 5.3, max: 9300 (nM) from 13 assay(s)
Experimental Data & Validation

Experimental Data

  • Method: X-RAY DIFFRACTION
  • Resolution: 3.60 Å
  • R-Value Free: 0.275 
  • R-Value Work: 0.239 
  • R-Value Observed: 0.240 
  • Space Group: P 2 21 21
Unit Cell:
Length ( Å )Angle ( ˚ )
a = 139.4α = 90
b = 163.2β = 90
c = 207.8γ = 90
Software Package:
Software NamePurpose
DENZOdata reduction
REFMACrefinement
PDB_EXTRACTdata extraction
ADSCdata collection
SCALEPACKdata scaling
PHASERphasing

Structure Validation

View Full Validation Report


Ligand Structure Quality Assessment 


Entry History 

Deposition Data

Revision History  (Full details and data files)

  • Version 1.0: 2013-05-08
    Type: Initial release
  • Version 1.1: 2013-05-29
    Changes: Database references
  • Version 1.2: 2024-02-28
    Changes: Data collection, Database references, Derived calculations