


Quantitative Comparison of Protein Dynamics in Live Cells and In Vitro by In-Cell 19F-NMR
Takaoka, Y., Kioi, Y., Morito, A., Otani, J., Arita, K., Ashihara, E., Ariyoshi, M., Tochio, H., Shirakawa, M., Hamachi, I.To be published.
Experimental Data Snapshot
Starting Model: experimental
View more details
Entity ID: 1 | |||||
|---|---|---|---|---|---|
| Molecule | Chains | Sequence Length | Organism | Details | Image |
| Carbonic anhydrase 1 | 260 | Homo sapiens | Mutation(s): 0 Gene Names: CA1 EC: 4.2.1.1 (PDB Primary Data), 4.2.1.69 (UniProt) | 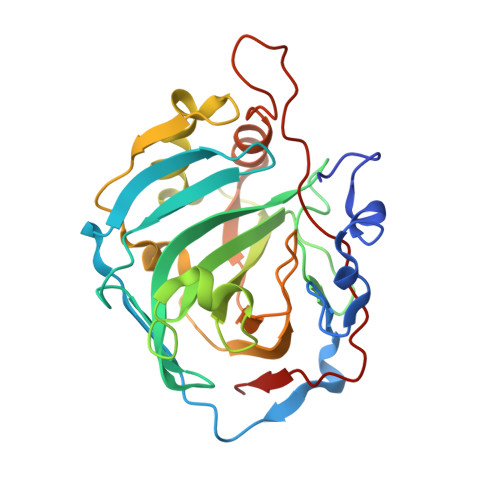 | |
UniProt & NIH Common Fund Data Resources | |||||
PHAROS: P00915 GTEx: ENSG00000133742 | |||||
Entity Groups | |||||
| Sequence Clusters | 30% Identity50% Identity70% Identity90% Identity95% Identity100% Identity | ||||
| UniProt Group | P00915 | ||||
Sequence AnnotationsExpand | |||||
Reference Sequence | |||||
| Ligands 3 Unique | |||||
|---|---|---|---|---|---|
| ID | Chains | Name / Formula / InChI Key | 2D Diagram | 3D Interactions | |
| FLB Download:Ideal Coordinates CCD File | C [auth A], F [auth B] | 1-(2-ethoxyethoxy)-3,5-bis(trifluoromethyl)benzene C12 H12 F6 O2 GWAJLKXPMOKZEL-UHFFFAOYSA-N |  | ||
| AZM Download:Ideal Coordinates CCD File | E [auth A], H [auth B] | 5-ACETAMIDO-1,3,4-THIADIAZOLE-2-SULFONAMIDE C4 H6 N4 O3 S2 BZKPWHYZMXOIDC-UHFFFAOYSA-N |  | ||
| ZN Download:Ideal Coordinates CCD File | D [auth A], G [auth B] | ZINC ION Zn PTFCDOFLOPIGGS-UHFFFAOYSA-N |  | ||
| Length ( Å ) | Angle ( ˚ ) |
|---|---|
| a = 62.039 | α = 90 |
| b = 65.28 | β = 90 |
| c = 120.485 | γ = 90 |
| Software Name | Purpose |
|---|---|
| ADSC | data collection |
| PHASER | phasing |
| PHENIX | refinement |
| HKL-2000 | data reduction |
| HKL-2000 | data scaling |


