


Dissection of the interaction between FAF1 UBX and p97
Park, J.K., Jeon, H., Lee, J.J., Kim, K.H., Lee, K.J., Kim, E.E.To be published.
Experimental Data Snapshot
Starting Model: experimental
View more details
wwPDB Validation 3D Report Full Report

Entity ID: 1 | |||||
|---|---|---|---|---|---|
| Molecule | Chains | Sequence Length | Organism | Details | Image |
| Transitional endoplasmic reticulum ATPase | 211 | Homo sapiens | Mutation(s): 0 Gene Names: VCP EC: 3.6.4.6 | 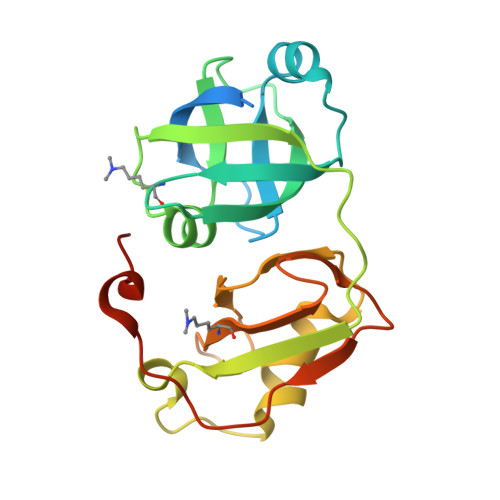 | |
UniProt & NIH Common Fund Data Resources | |||||
PHAROS: P55072 GTEx: ENSG00000165280 | |||||
Entity Groups | |||||
| Sequence Clusters | 30% Identity50% Identity70% Identity90% Identity95% Identity100% Identity | ||||
| UniProt Group | P55072 | ||||
Sequence AnnotationsExpand | |||||
Reference Sequence | |||||
Entity ID: 2 | |||||
|---|---|---|---|---|---|
| Molecule | Chains | Sequence Length | Organism | Details | Image |
| FAS-associated factor 1 | 84 | Homo sapiens | Mutation(s): 0 Gene Names: FAF1, UBXD12, UBXN3A, CGI-03 | 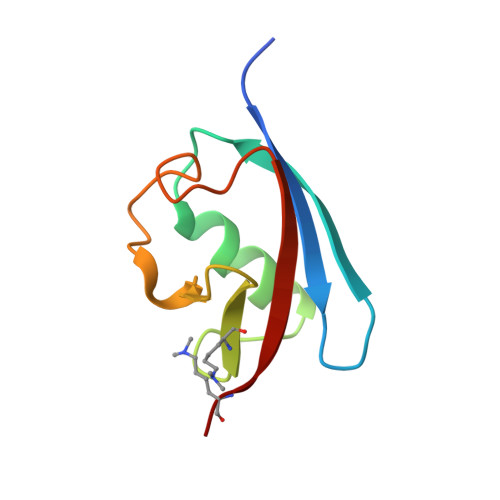 | |
UniProt & NIH Common Fund Data Resources | |||||
PHAROS: Q9UNN5 GTEx: ENSG00000185104 | |||||
Entity Groups | |||||
| Sequence Clusters | 30% Identity50% Identity70% Identity90% Identity95% Identity100% Identity | ||||
| UniProt Group | Q9UNN5 | ||||
Sequence AnnotationsExpand | |||||
Reference Sequence | |||||
| Modified Residues 1 Unique | |||||
|---|---|---|---|---|---|
| ID | Chains | Type | Formula | 2D Diagram | Parent |
| MLY Query on MLY | A | L-PEPTIDE LINKING | C8 H18 N2 O2 |  | LYS |
| Length ( Å ) | Angle ( ˚ ) |
|---|---|
| a = 67.49 | α = 90 |
| b = 59.938 | β = 114.83 |
| c = 75.541 | γ = 90 |
| Software Name | Purpose |
|---|---|
| ADSC | data collection |
| MOLREP | phasing |
| CNS | refinement |
| HKL-2000 | data reduction |
| HKL-2000 | data scaling |


