3QJS

The structure of and photolytic induced changes of carbon monoxide binding to the cytochrome ba3-oxidase from Thermus thermophilus


Experimental Data Snapshot

  • Method: X-RAY DIFFRACTION
  • Resolution: 2.80 Å
  • R-Value Free: 0.265 
  • R-Value Work: 0.215 
  • R-Value Observed: 0.218 

wwPDB Validation   3D Report Full Report


Ligand Structure Quality Assessment 


This is version 1.4 of the entry. See complete history


Literature

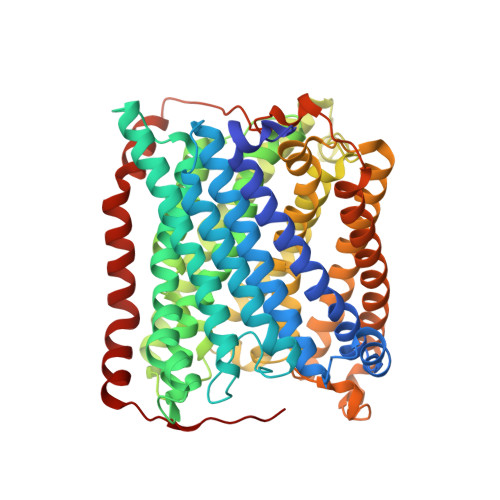
Structural changes that occur upon photolysis of the Fe(II)(a3)-CO complex in the cytochrome ba(3)-oxidase of Thermus thermophilus: A combined X-ray crystallographic and infrared spectral study demonstrates CO binding to Cu(B).

Liu, B.Zhang, Y.Sage, J.T.Soltis, S.M.Doukov, T.Chen, Y.Stout, C.D.Fee, J.A.

(2012) Biochim Biophys Acta 1817: 658-665

  • DOI: https://doi.org/10.1016/j.bbabio.2011.12.010
  • Primary Citation of Related Structures:  
    3QJQ, 3QJR, 3QJS, 3QJT, 3QJU, 3QJV

  • PubMed Abstract: 

    The purpose of the work was to provide a crystallographic demonstration of the venerable idea that CO photolyzed from ferrous heme-a(3) moves to the nearby cuprous ion in the cytochrome c oxidases. Crystal structures of CO-bound cytochrome ba(3)-oxidase from Thermus thermophilus, determined at ~2.8-3.2Å resolution, reveal a Fe-C distance of ~2.0Å, a Cu-O distance of 2.4Å and a Fe-C-O angle of ~126°. Upon photodissociation at 100K, X-ray structures indicate loss of Fe(a3)-CO and appearance of Cu(B)-CO having a Cu-C distance of ~1.9Å and an O-Fe distance of ~2.3Å. Absolute FTIR spectra recorded from single crystals of reduced ba(3)-CO that had not been exposed to X-ray radiation, showed several peaks around 1975cm(-1); after photolysis at 100K, the absolute FTIR spectra also showed a significant peak at 2050cm(-1). Analysis of the 'light' minus 'dark' difference spectra showed four very sharp CO stretching bands at 1970cm(-1), 1977cm(-1), 1981cm(-1), and 1985cm(-1), previously assigned to the Fe(a3)-CO complex, and a significantly broader CO stretching band centered at ~2050cm(-1), previously assigned to the CO stretching frequency of Cu(B) bound CO. As expected for light propagating along the tetragonal axis of the P4(3)2(1)2 space group, the single crystal spectra exhibit negligible dichroism. Absolute FTIR spectrometry of a CO-laden ba(3) crystal, exposed to an amount of X-ray radiation required to obtain structural data sets before FTIR characterization, showed a significant signal due to photogenerated CO(2) at 2337cm(-1) and one from traces of CO at 2133cm(-1); while bands associated with CO bound to either Fe(a3) or to Cu(B) in "light" minus "dark" FTIR difference spectra shifted and broadened in response to X-ray exposure. In spite of considerable radiation damage to the crystals, both X-ray analysis at 2.8 and 3.2Å and FTIR spectra support the long-held position that photolysis of Fe(a3)-CO in cytochrome c oxidases leads to significant trapping of the CO on the Cu(B) atom; Fe(a3) and Cu(B) ligation, at the resolutions reported here, are otherwise unaltered.


  • Organizational Affiliation

    The Scripps Research Institute, Department of Molecular Biology, La Jolla, CA 92037, USA.


Macromolecules
Find similar proteins by:  (by identity cutoff)  |  3D Structure
Entity ID: 1
MoleculeChains Sequence LengthOrganismDetailsImage
Cytochrome c oxidase subunit 1568Thermus thermophilus HB8Mutation(s): 0 
Gene Names: cbaATTHA1135
EC: 1.9.3.1
Membrane Entity: Yes 
UniProt
Find proteins for Q5SJ79 (Thermus thermophilus (strain ATCC 27634 / DSM 579 / HB8))
Explore Q5SJ79 
Go to UniProtKB:  Q5SJ79
Entity Groups  
Sequence Clusters30% Identity50% Identity70% Identity90% Identity95% Identity100% Identity
UniProt GroupQ5SJ79
Sequence Annotations
Expand
  • Reference Sequence
Find similar proteins by:  (by identity cutoff)  |  3D Structure
Entity ID: 2
MoleculeChains Sequence LengthOrganismDetailsImage
Cytochrome c oxidase subunit 2168Thermus thermophilus HB8Mutation(s): 0 
Gene Names: cbaBctaCTTHA1134
EC: 1.9.3.1
Membrane Entity: Yes 
UniProt
Find proteins for Q5SJ80 (Thermus thermophilus (strain ATCC 27634 / DSM 579 / HB8))
Explore Q5SJ80 
Go to UniProtKB:  Q5SJ80
Entity Groups  
Sequence Clusters30% Identity50% Identity70% Identity90% Identity95% Identity100% Identity
UniProt GroupQ5SJ80
Sequence Annotations
Expand
  • Reference Sequence
Find similar proteins by:  (by identity cutoff)  |  3D Structure
Entity ID: 3
MoleculeChains Sequence LengthOrganismDetailsImage
Cytochrome c oxidase polypeptide 2A34Thermus thermophilus HB8Mutation(s): 0 
Gene Names: cbaDTTHA1133
EC: 1.9.3.1
Membrane Entity: Yes 
UniProt
Find proteins for P82543 (Thermus thermophilus (strain ATCC 27634 / DSM 579 / HB8))
Explore P82543 
Go to UniProtKB:  P82543
Entity Groups  
Sequence Clusters30% Identity50% Identity70% Identity90% Identity95% Identity100% Identity
UniProt GroupP82543
Sequence Annotations
Expand
  • Reference Sequence
Small Molecules
Ligands 5 Unique
IDChains Name / Formula / InChI Key2D Diagram3D Interactions
HAS
Query on HAS

Download Ideal Coordinates CCD File 
F [auth A]HEME-AS
C54 H64 Fe N4 O6
PDYODZVCODUKFH-ZOMLSHGTSA-L
HEM
Query on HEM

Download Ideal Coordinates CCD File 
E [auth A]PROTOPORPHYRIN IX CONTAINING FE
C34 H32 Fe N4 O4
KABFMIBPWCXCRK-RGGAHWMASA-L
CUA
Query on CUA

Download Ideal Coordinates CCD File 
H [auth B]DINUCLEAR COPPER ION
Cu2
ALKZAGKDWUSJED-UHFFFAOYSA-N
CU1
Query on CU1

Download Ideal Coordinates CCD File 
D [auth A]COPPER (I) ION
Cu
VMQMZMRVKUZKQL-UHFFFAOYSA-N
CMO
Query on CMO

Download Ideal Coordinates CCD File 
G [auth A]CARBON MONOXIDE
C O
UGFAIRIUMAVXCW-UHFFFAOYSA-N
Experimental Data & Validation

Experimental Data

  • Method: X-RAY DIFFRACTION
  • Resolution: 2.80 Å
  • R-Value Free: 0.265 
  • R-Value Work: 0.215 
  • R-Value Observed: 0.218 
  • Space Group: P 41 21 2
Unit Cell:
Length ( Å )Angle ( ˚ )
a = 114.206α = 90
b = 114.206β = 90
c = 146.934γ = 90
Software Package:
Software NamePurpose
Blu-Icedata collection
PHASERphasing
REFMACrefinement
MOSFLMdata reduction
SCALAdata scaling

Structure Validation

View Full Validation Report


Ligand Structure Quality Assessment 


Entry History 

Deposition Data

Revision History  (Full details and data files)

  • Version 1.0: 2012-01-25
    Type: Initial release
  • Version 1.1: 2012-04-04
    Changes: Database references
  • Version 1.2: 2017-11-08
    Changes: Refinement description
  • Version 1.3: 2018-01-24
    Changes: Database references, Structure summary
  • Version 1.4: 2023-09-13
    Changes: Data collection, Database references, Derived calculations, Refinement description