3QFJ

The complex between TCR A6 and human Class I MHC HLA-A2 with the modified TAX (Y5F) peptide


Experimental Data Snapshot

  • Method: X-RAY DIFFRACTION
  • Resolution: 2.29 Å
  • R-Value Free: 0.271 
  • R-Value Work: 0.218 
  • R-Value Observed: 0.221 

wwPDB Validation   3D Report Full Report


This is version 1.1 of the entry. See complete history


Literature

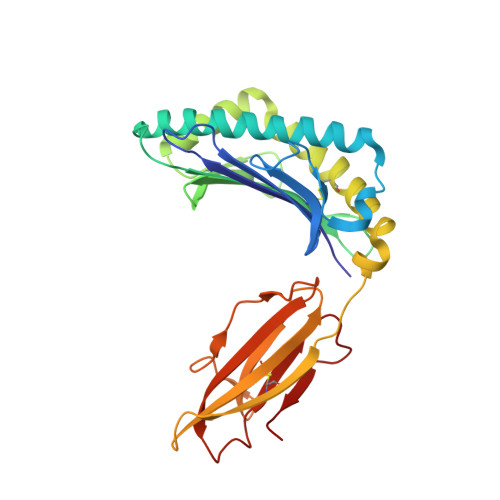
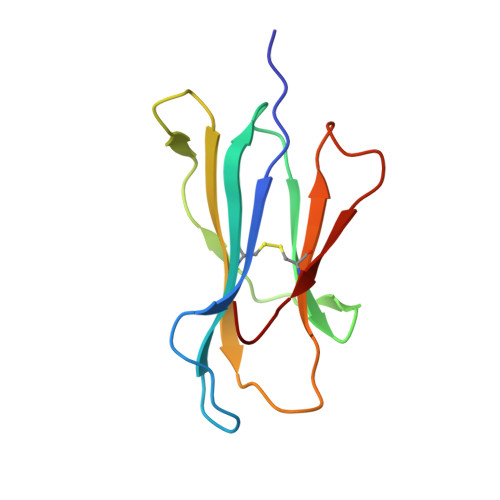
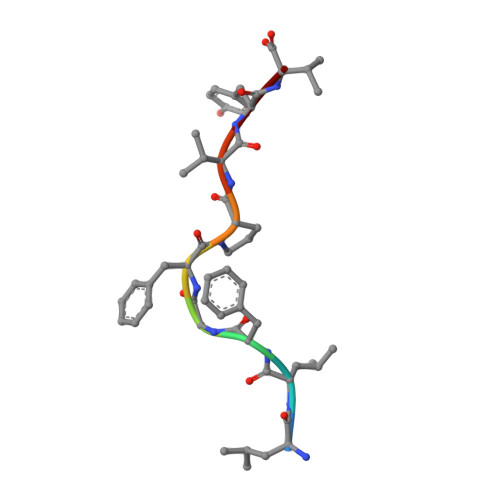
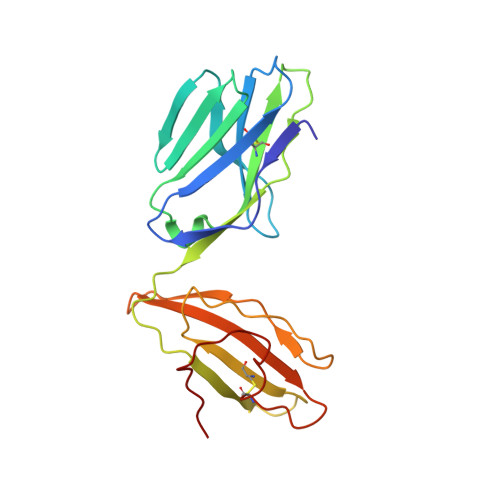
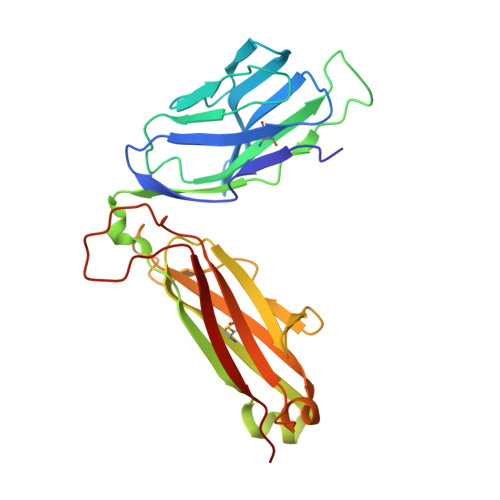
Disparate degrees of hypervariable loop flexibility control T-cell receptor cross-reactivity, specificity, and binding mechanism.

Scott, D.R.Borbulevych, O.Y.Piepenbrink, K.H.Corcelli, S.A.Baker, B.M.

(2011) J Mol Biol 414: 385-400

  • DOI: https://doi.org/10.1016/j.jmb.2011.10.006
  • Primary Citation of Related Structures:  
    3QFJ, 3QH3

  • PubMed Abstract: 

    αβ T-cell receptors (TCRs) recognize multiple antigenic peptides bound and presented by major histocompatibility complex molecules. TCR cross-reactivity has been attributed in part to the flexibility of TCR complementarity-determining region (CDR) loops, yet there have been limited direct studies of loop dynamics to determine the extent of its role. Here we studied the flexibility of the binding loops of the αβ TCR A6 using crystallographic, spectroscopic, and computational methods. A significant role for flexibility in binding and cross-reactivity was indicated only for the CDR3α and CDR3β hypervariable loops. Examination of the energy landscapes of these two loops indicated that CDR3β possesses a broad, smooth energy landscape, leading to rapid sampling in the free TCR of a range of conformations compatible with different ligands. The landscape for CDR3α is more rugged, resulting in more limited conformational sampling that leads to specificity for a reduced set of peptides as well as the major histocompatibility complex protein. In addition to informing on the mechanisms of cross-reactivity and specificity, the energy landscapes of the two loops indicate a complex mechanism for TCR binding, incorporating elements of both conformational selection and induced fit in a manner that blends features of popular models for TCR recognition.


  • Organizational Affiliation

    Department of Chemistry and Biochemistry, University of Notre Dame, Notre Dame, IN 46556, USA.


Macromolecules
Find similar proteins by:  (by identity cutoff)  |  3D Structure
Entity ID: 1
MoleculeChains Sequence LengthOrganismDetailsImage
HLA class I histocompatibility antigen, A-2 alpha chain275Homo sapiensMutation(s): 0 
Gene Names: HLA-AHLAA
UniProt & NIH Common Fund Data Resources
Find proteins for P04439 (Homo sapiens)
Explore P04439 
Go to UniProtKB:  P04439
PHAROS:  P04439
GTEx:  ENSG00000206503 
Entity Groups  
Sequence Clusters30% Identity50% Identity70% Identity90% Identity95% Identity100% Identity
UniProt GroupP04439
Sequence Annotations
Expand
  • Reference Sequence
Find similar proteins by:  (by identity cutoff)  |  3D Structure
Entity ID: 2
MoleculeChains Sequence LengthOrganismDetailsImage
Beta-2-microglobulin100Homo sapiensMutation(s): 0 
Gene Names: B2MCDABP0092HDCMA22P
UniProt & NIH Common Fund Data Resources
Find proteins for P61769 (Homo sapiens)
Explore P61769 
Go to UniProtKB:  P61769
PHAROS:  P61769
GTEx:  ENSG00000166710 
Entity Groups  
Sequence Clusters30% Identity50% Identity70% Identity90% Identity95% Identity100% Identity
UniProt GroupP61769
Sequence Annotations
Expand
  • Reference Sequence

Find similar proteins by:  Sequence   |   3D Structure  

Entity ID: 3
MoleculeChains Sequence LengthOrganismDetailsImage
TAX(Y5F) peptide9N/AMutation(s): 0 
Sequence Annotations
Expand
  • Reference Sequence
Find similar proteins by:  (by identity cutoff)  |  3D Structure
Entity ID: 4
MoleculeChains Sequence LengthOrganismDetailsImage
A6 alpha chain200Homo sapiensMutation(s): 0 
Entity Groups  
Sequence Clusters30% Identity50% Identity70% Identity90% Identity95% Identity100% Identity
Sequence Annotations
Expand
  • Reference Sequence
Find similar proteins by:  (by identity cutoff)  |  3D Structure
Entity ID: 5
MoleculeChains Sequence LengthOrganismDetailsImage
A6 beta chain245Homo sapiensMutation(s): 0 
Entity Groups  
Sequence Clusters30% Identity50% Identity70% Identity90% Identity95% Identity100% Identity
Sequence Annotations
Expand
  • Reference Sequence
Small Molecules
Ligands 1 Unique
IDChains Name / Formula / InChI Key2D Diagram3D Interactions
GOL
Query on GOL

Download Ideal Coordinates CCD File 
F [auth A]
G [auth A]
H [auth B]
I [auth B]
J [auth B]
F [auth A],
G [auth A],
H [auth B],
I [auth B],
J [auth B],
K [auth C],
L [auth D],
M [auth E],
N [auth E],
O [auth E],
P [auth E]
GLYCEROL
C3 H8 O3
PEDCQBHIVMGVHV-UHFFFAOYSA-N
Experimental Data & Validation

Experimental Data

  • Method: X-RAY DIFFRACTION
  • Resolution: 2.29 Å
  • R-Value Free: 0.271 
  • R-Value Work: 0.218 
  • R-Value Observed: 0.221 
  • Space Group: C 1 2 1
Unit Cell:
Length ( Å )Angle ( ˚ )
a = 224.008α = 90
b = 48.098β = 91.02
c = 92.959γ = 90
Software Package:
Software NamePurpose
SCALEPACKdata scaling
REFMACrefinement
PDB_EXTRACTdata extraction
HKL-2000data reduction
HKL-2000data scaling
MOLREPphasing

Structure Validation

View Full Validation Report


Entry History 

Deposition Data

Revision History  (Full details and data files)

  • Version 1.0: 2012-01-11
    Type: Initial release
  • Version 1.1: 2023-09-13
    Changes: Data collection, Database references, Derived calculations, Refinement description