Correlating structure and ligand affinity in drug discovery: a cautionary tale involving second shell residues.
Tziridis, A., Rauh, D., Neumann, P., Kolenko, P., Menzel, A., Brauer, U., Ursel, C., Steinmetzer, P., Sturzebecher, J., Schweinitz, A., Steinmetzer, T., Stubbs, M.T.(2014) Biol Chem 395: 891-903
- PubMed: 25003390 Search on PubMed
- DOI: https://doi.org/10.1515/hsz-2014-0158
- Primary Citation Related Structures:
3PLB, 3PLK, 3PLP, 3PM3, 3PMJ, 3PWB, 3PWC, 3PYH, 3Q00, 3UNQ, 3UNS, 3UOP, 3UPE, 3UQO, 3UQV, 3UUZ, 3UWI, 3UY9, 3V12, 3V13 - PubMed Abstract:
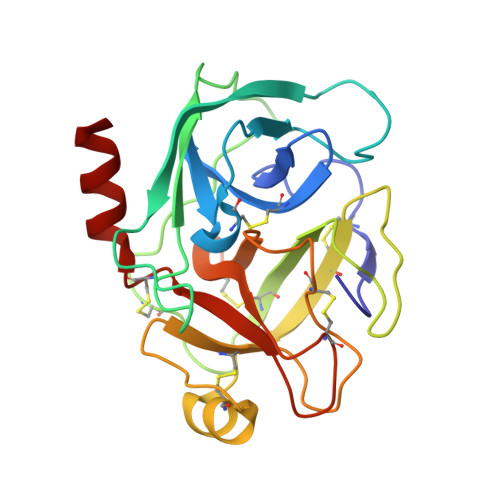
A high-resolution crystallographic structure determination of a protein-ligand complex is generally accepted as the 'gold standard' for structure-based drug design, yet the relationship between structure and affinity is neither obvious nor straightforward. Here we analyze the interactions of a series of serine proteinase inhibitors with trypsin variants onto which the ligand-binding site of factor Xa has been grafted. Despite conservative mutations of only two residues not immediately in contact with ligands (second shell residues), significant differences in the affinity profiles of the variants are observed. Structural analyses demonstrate that these are due to multiple effects, including differences in the structure of the binding site, differences in target flexibility and differences in inhibitor binding modes. The data presented here highlight the myriad competing microscopic processes that contribute to protein-ligand interactions and emphasize the difficulties in predicting affinity from structure.