


Crystal structure of a putative Ribokinase (II)in complex with ATP and Mg+2 from E.coli
Satyanarayana, L., Burley, S.K., Swaminathan, S.To be published.
Experimental Data Snapshot
Entity ID: 1 | |||||
|---|---|---|---|---|---|
| Molecule | Chains | Sequence Length | Organism | Details | Image |
| putative Ribokinase II | 330 | Escherichia coli O6 | Mutation(s): 0 Gene Names: 1040397, c4014 EC: 2.7.1 | 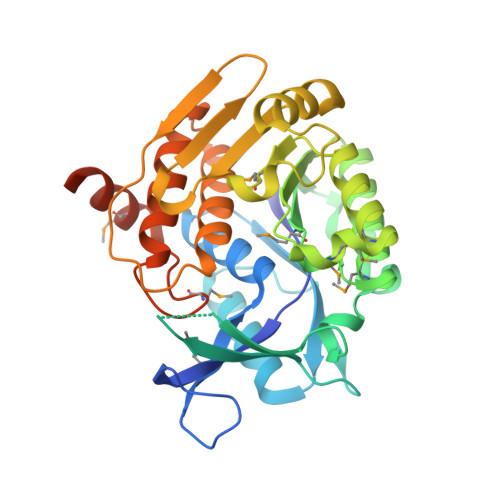 | |
UniProt | |||||
Find proteins for A0A0H2VDX9 (Escherichia coli O6:H1 (strain CFT073 / ATCC 700928 / UPEC)) Explore A0A0H2VDX9 Go to UniProtKB: A0A0H2VDX9 | |||||
Entity Groups | |||||
| Sequence Clusters | 30% Identity50% Identity70% Identity90% Identity95% Identity100% Identity | ||||
| UniProt Group | A0A0H2VDX9 | ||||
Sequence AnnotationsExpand | |||||
Reference Sequence | |||||
| Ligands 2 Unique | |||||
|---|---|---|---|---|---|
| ID | Chains | Name / Formula / InChI Key | 2D Diagram | 3D Interactions | |
| ATP Download:Ideal Coordinates CCD File | D [auth A], G [auth B] | ADENOSINE-5'-TRIPHOSPHATE C10 H16 N5 O13 P3 ZKHQWZAMYRWXGA-KQYNXXCUSA-N |  | ||
| MG Download:Ideal Coordinates CCD File | C [auth A], E [auth A], F [auth B] | MAGNESIUM ION Mg JLVVSXFLKOJNIY-UHFFFAOYSA-N |  | ||
| Modified Residues 1 Unique | |||||
|---|---|---|---|---|---|
| ID | Chains | Type | Formula | 2D Diagram | Parent |
| MSE Query on MSE | A, B | L-PEPTIDE LINKING | C5 H11 N O2 Se |  | MET |
| Length ( Å ) | Angle ( ˚ ) |
|---|---|
| a = 63.304 | α = 90 |
| b = 87.256 | β = 90 |
| c = 112.249 | γ = 90 |
| Software Name | Purpose |
|---|---|
| CBASS | data collection |
| SHELXCD | phasing |
| SHARP | phasing |
| CNS | refinement |
| DENZO | data reduction |
| HKL-2000 | data scaling |


