


Kinetic and Crystallographic Studies on Glyceraldehyde-3-Phosphate Dehydrogenase from Trypanosoma cruzi in Complex with Iodoacetate.
Guido, R.V.C., Balliano, T.L., Andricopulo, A.D., Oliva, G.(2009) Letters In Drug Design & Discovery 6: 210-214
Experimental Data Snapshot
Starting Model: experimental
View more details
(2009) Letters In Drug Design & Discovery 6: 210-214
Entity ID: 1 | |||||
|---|---|---|---|---|---|
| Molecule | Chains | Sequence Length | Organism | Details | Image |
| Glyceraldehyde-3-phosphate dehydrogenase, glycosomal | 359 | Trypanosoma cruzi | Mutation(s): 0 Gene Names: TcGAP EC: 1.2.1.12 | 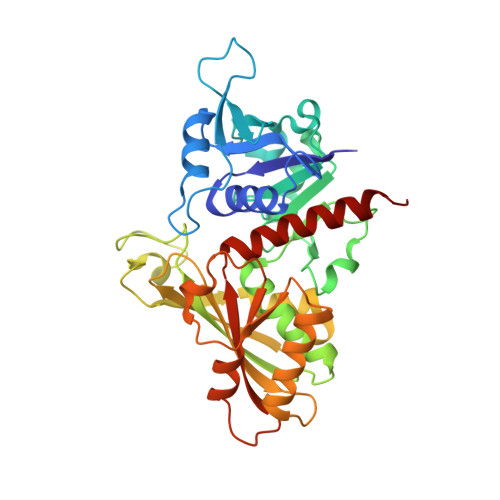 | |
UniProt | |||||
Entity Groups | |||||
| Sequence Clusters | 30% Identity50% Identity70% Identity90% Identity95% Identity100% Identity | ||||
| UniProt Group | P22513 | ||||
Sequence AnnotationsExpand | |||||
Reference Sequence | |||||
Entity ID: 2 | |||||
|---|---|---|---|---|---|
| Molecule | Chains | Sequence Length | Organism | Details | Image |
| Glyceraldehyde-3-phosphate dehydrogenase, glycosomal | 359 | Trypanosoma cruzi | Mutation(s): 0 Gene Names: TcGAP EC: 1.2.1.12 | 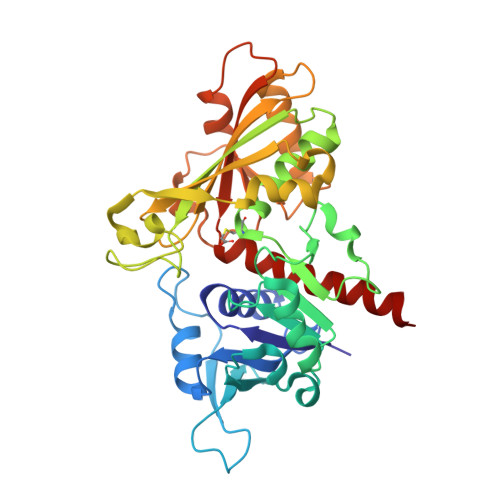 | |
UniProt | |||||
Entity Groups | |||||
| Sequence Clusters | 30% Identity50% Identity70% Identity90% Identity95% Identity100% Identity | ||||
| UniProt Group | P22513 | ||||
Sequence AnnotationsExpand | |||||
Reference Sequence | |||||
| Ligands 2 Unique | |||||
|---|---|---|---|---|---|
| ID | Chains | Name / Formula / InChI Key | 2D Diagram | 3D Interactions | |
| NAD Download:Ideal Coordinates CCD File | E [auth A], F [auth B], G [auth C], I [auth D] | NICOTINAMIDE-ADENINE-DINUCLEOTIDE C21 H27 N7 O14 P2 BAWFJGJZGIEFAR-NNYOXOHSSA-N |  | ||
| GOL Download:Ideal Coordinates CCD File | H [auth C] | GLYCEROL C3 H8 O3 PEDCQBHIVMGVHV-UHFFFAOYSA-N |  | ||
| Modified Residues 1 Unique | |||||
|---|---|---|---|---|---|
| ID | Chains | Type | Formula | 2D Diagram | Parent |
| CCS Query on CCS | C | L-PEPTIDE LINKING | C5 H9 N O4 S |  | CYS |
| Length ( Å ) | Angle ( ˚ ) |
|---|---|
| a = 78.755 | α = 90 |
| b = 83.713 | β = 96.44 |
| c = 105.611 | γ = 90 |
| Software Name | Purpose |
|---|---|
| REFMAC | refinement |
| MAR345dtb | data collection |
| MOSFLM | data reduction |
| SCALA | data scaling |
| MOLREP | phasing |
| PHENIX | refinement |


