


Crystal structures of fms1 in complex with its inhibitors
Huang, Q., Hao, Q.To be published.
Experimental Data Snapshot
Starting Model: experimental
View more details
Entity ID: 1 | |||||
|---|---|---|---|---|---|
| Molecule | Chains | Sequence Length | Organism | Details | Image |
| Polyamine oxidase FMS1 | 516 | Saccharomyces cerevisiae | Mutation(s): 0 Gene Names: Fms1 EC: 1.5.3.11 (PDB Primary Data), 1.5.3.17 (UniProt) | 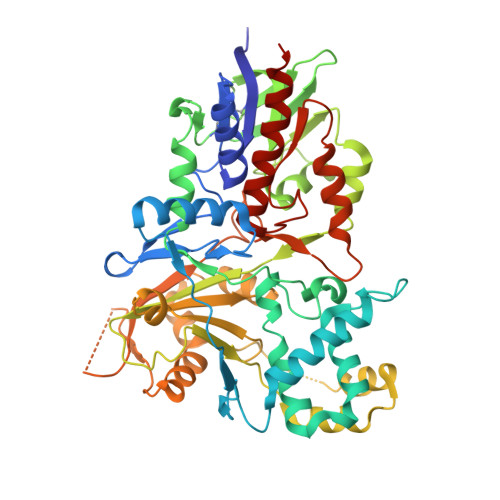 | |
UniProt | |||||
Entity Groups | |||||
| Sequence Clusters | 30% Identity50% Identity70% Identity90% Identity95% Identity100% Identity | ||||
| UniProt Group | P50264 | ||||
Sequence AnnotationsExpand | |||||
Reference Sequence | |||||
| Ligands 2 Unique | |||||
|---|---|---|---|---|---|
| ID | Chains | Name / Formula / InChI Key | 2D Diagram | 3D Interactions | |
| FAD Download:Ideal Coordinates CCD File | C [auth A], E [auth B] | FLAVIN-ADENINE DINUCLEOTIDE C27 H33 N9 O15 P2 VWWQXMAJTJZDQX-UYBVJOGSSA-N |  | ||
| 297 Download:Ideal Coordinates CCD File | D [auth A], F [auth B] | dodecane-1,12-diamine C12 H28 N2 QFTYSVGGYOXFRQ-UHFFFAOYSA-N |  | ||
| Length ( Å ) | Angle ( ˚ ) |
|---|---|
| a = 102.205 | α = 90 |
| b = 215.323 | β = 90 |
| c = 116.586 | γ = 90 |
| Software Name | Purpose |
|---|---|
| DENZO | data reduction |
| SCALEPACK | data scaling |
| CNS | refinement |
| PDB_EXTRACT | data extraction |
| HKL-2000 | data collection |
| CNS | phasing |


