2H3X

Crystal Structure of an Electron Transfer Complex Between Aromatic Amine Dehydrogenase and Azurin from Alcaligenes Faecalis (Form 3)


Experimental Data Snapshot

  • Method: X-RAY DIFFRACTION
  • Resolution: 2.50 Å
  • R-Value Free: 0.230 
  • R-Value Work: 0.183 

wwPDB Validation   3D Report Full Report


This is version 1.2 of the entry. See complete history


Literature

Crystal Structure of an Electron Transfer Complex between Aromatic Amine Dehydrogenase and Azurin from Alcaligenes faecalis.

Sukumar, N.Chen, Z.Ferrari, D.Merli, A.Rossi, G.L.Bellamy, H.D.Chistoserdov, A.Davidson, V.L.Mathews, F.S.

(2006) Biochemistry 45: 13500-13510

  • DOI: https://doi.org/10.1021/bi0612972
  • Primary Citation of Related Structures:  
    2H3X, 2H47, 2IAA

  • PubMed Abstract: 

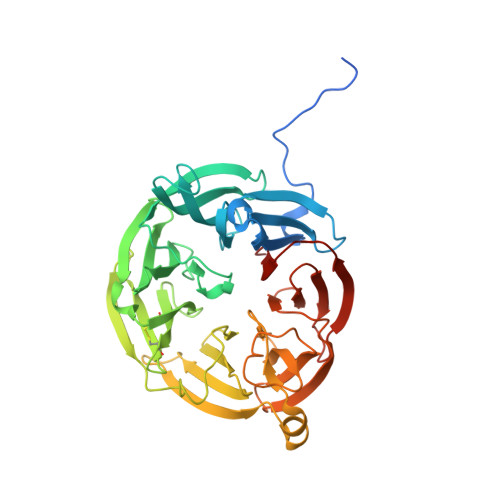
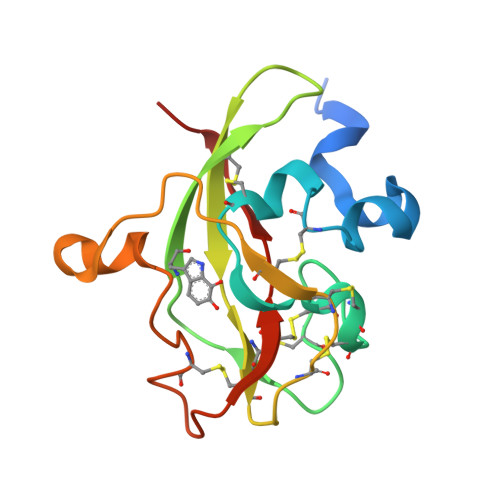
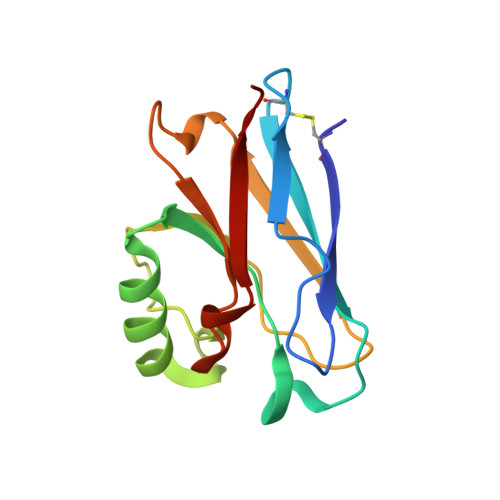
    The crystal structure of an electron transfer complex of aromatic amine dehydrogenase (AADH) and azurin is presented. Electrons are transferred from the tryptophan tryptophylquinone (TTQ) cofactor of AADH to the type I copper of the cupredoxin azurin. This structure is compared with the complex of the TTQ-containing methylamine dehydrogenase (MADH) and the cupredoxin amicyanin. Despite significant similarities between the two quinoproteins and the two cupredoxins, each is specific for its respective partner and the ionic strength dependence and magnitude of the binding constant for each complex are quite different. The AADH-azurin interface is largely hydrophobic, covering approximately 500 A(2) of surface on each molecule, with one direct hydrogen bond linking them. The closest distance from TTQ to copper is 12.6 A compared with a distance of 9.3 A in the MADH-amicyanin complex. When the MADH-amicyanin complex is aligned with the AADH-azurin complex, the amicyanin lies on top of the azurin but is oriented quite differently. Although the copper atoms differ in position by approximately 4.7 A, the amicyanin bound to MADH appears to be rotated approximately 90 degrees from its aligned position with azurin. Comparison of the structures of the two complexes identifies features of the interface that dictate the specificity of the protein-protein interaction and determine the rate of interprotein electron transfer.


  • Organizational Affiliation

    Department of Biochemistry and Molecular Biophysics, Washington University School of Medicine, St. Louis, Missouri 65211, USA.


Macromolecules
Find similar proteins by:  (by identity cutoff)  |  3D Structure
Entity ID: 1
MoleculeChains Sequence LengthOrganismDetailsImage
Aromatic Amine Dehydrogenase
A, D
390Alcaligenes faecalisMutation(s): 0 
EC: 1.4.99.4
UniProt
Find proteins for P84888 (Alcaligenes faecalis)
Explore P84888 
Go to UniProtKB:  P84888
Entity Groups  
Sequence Clusters30% Identity50% Identity70% Identity90% Identity95% Identity100% Identity
UniProt GroupP84888
Sequence Annotations
Expand
  • Reference Sequence
Find similar proteins by:  (by identity cutoff)  |  3D Structure
Entity ID: 2
MoleculeChains Sequence LengthOrganismDetailsImage
Aromatic Amine Dehydrogenase
B, E
135Alcaligenes faecalisMutation(s): 0 
EC: 1.4.99.4
UniProt
Find proteins for P84887 (Alcaligenes faecalis)
Explore P84887 
Go to UniProtKB:  P84887
Entity Groups  
Sequence Clusters30% Identity50% Identity70% Identity90% Identity95% Identity100% Identity
UniProt GroupP84887
Sequence Annotations
Expand
  • Reference Sequence
Find similar proteins by:  (by identity cutoff)  |  3D Structure
Entity ID: 3
MoleculeChains Sequence LengthOrganismDetailsImage
Azurin
C, F
128Alcaligenes faecalisMutation(s): 0 
UniProt
Find proteins for P00281 (Alcaligenes faecalis)
Explore P00281 
Go to UniProtKB:  P00281
Entity Groups  
Sequence Clusters30% Identity50% Identity70% Identity90% Identity95% Identity100% Identity
UniProt GroupP00281
Sequence Annotations
Expand
  • Reference Sequence
Small Molecules
Modified Residues  1 Unique
IDChains TypeFormula2D DiagramParent
TRQ
Query on TRQ
B, E
L-PEPTIDE LINKINGC11 H10 N2 O4TRP
Experimental Data & Validation

Experimental Data

  • Method: X-RAY DIFFRACTION
  • Resolution: 2.50 Å
  • R-Value Free: 0.230 
  • R-Value Work: 0.183 
  • Space Group: P 21 21 21
Unit Cell:
Length ( Å )Angle ( ˚ )
a = 64.953α = 90
b = 94.762β = 90
c = 211.482γ = 90
Software Package:
Software NamePurpose
HKL-2000data collection
SCALEPACKdata scaling
MOLREPphasing
CNSrefinement
HKL-2000data reduction

Structure Validation

View Full Validation Report


Entry History 

Deposition Data

Revision History  (Full details and data files)

  • Version 1.0: 2006-11-21
    Type: Initial release
  • Version 1.1: 2008-05-01
    Changes: Version format compliance
  • Version 1.2: 2011-07-13
    Changes: Version format compliance