2Q0O

Crystal structure of an anti-activation complex in bacterial quorum sensing


Experimental Data Snapshot

  • Method: X-RAY DIFFRACTION
  • Resolution: 2.00 Å
  • R-Value Free: 0.276 
  • R-Value Work: 0.235 
  • R-Value Observed: 0.235 

wwPDB Validation   3D Report Full Report


Ligand Structure Quality Assessment 


This is version 1.2 of the entry. See complete history


Literature

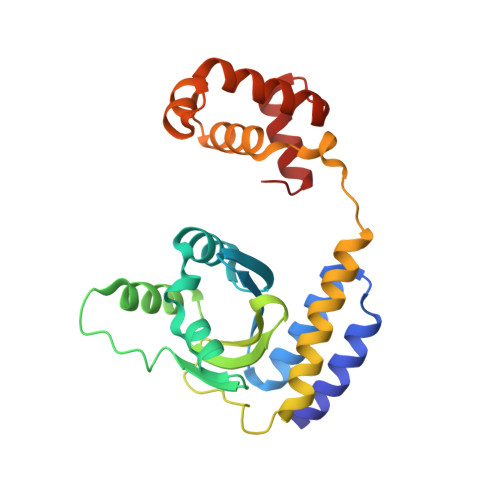
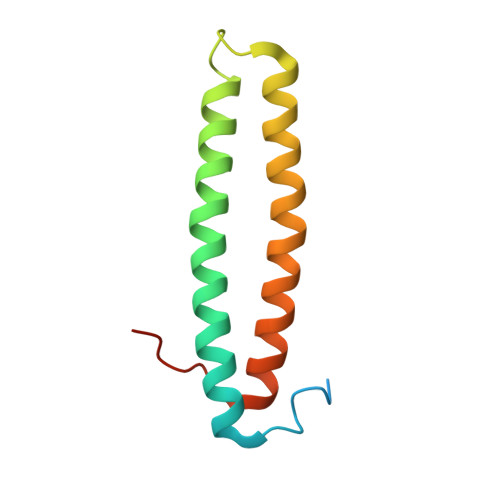
Structural basis for antiactivation in bacterial quorum sensing.

Chen, G.Jeffrey, P.D.Fuqua, C.Shi, Y.Chen, L.

(2007) Proc Natl Acad Sci U S A 104: 16474-16479

  • DOI: https://doi.org/10.1073/pnas.0704843104
  • Primary Citation of Related Structures:  
    2Q0O

  • PubMed Abstract: 

    Bacteria can communicate via diffusible signal molecules they generate and release to coordinate their behavior in response to the environment. Signal molecule concentration is often proportional to bacterial population density, and when this reaches a critical concentration, reflecting a bacterial quorum, specific behaviors including virulence, symbiosis, and horizontal gene transfer are activated. Quorum-sensing regulation in many Gram-negative bacteria involves acylated homoserine lactone signals that are perceived through binding to LuxR-type, acylated-homoserine-lactone-responsive transcription factors. Bacteria of the rhizobial group employ the LuxR-type transcriptional activator TraR in quorum sensing, and its activity is further regulated through interactions with the TraM antiactivator. In this study, we have crystallographically determined the 3D structure of the TraR-TraM antiactivation complex from Rhizobium sp. strain NGR234. Unexpectedly, the antiactivator TraM binds to TraR at a site distinct from its DNA-binding motif and induces an allosteric conformational change in the protein, thereby preventing DNA binding. Structural analysis reveals a highly conserved TraR-TraM interface and suggests a mechanism for antiactivation complex formation. This structure may inform alternative strategies to control quorum-sensing-regulated microbial activity including amelioration of infectious disease and antibiotic resistance. In addition, the structural basis of antiactivation presents a regulatory interaction that provides general insights relevant to the field of transcription regulation and signal transduction.


  • Organizational Affiliation

    Department of Biology, Indiana University, 915 East Third Street, Bloomington, IN 47405, USA.


Macromolecules
Find similar proteins by:  (by identity cutoff)  |  3D Structure
Entity ID: 1
MoleculeChains Sequence LengthOrganismDetailsImage
Probable transcriptional activator protein traR
A, B
236Sinorhizobium fredii NGR234Mutation(s): 0 
Gene Names: traR
UniProt
Find proteins for P55407 (Sinorhizobium fredii (strain NBRC 101917 / NGR234))
Explore P55407 
Go to UniProtKB:  P55407
Entity Groups  
Sequence Clusters30% Identity50% Identity70% Identity90% Identity95% Identity100% Identity
UniProt GroupP55407
Sequence Annotations
Expand
  • Reference Sequence
Find similar proteins by:  (by identity cutoff)  |  3D Structure
Entity ID: 2
MoleculeChains Sequence LengthOrganismDetailsImage
Probable transcriptional repressor traM
C, D
107Sinorhizobium fredii NGR234Mutation(s): 0 
Gene Names: traM
UniProt
Find proteins for P55408 (Sinorhizobium fredii (strain NBRC 101917 / NGR234))
Explore P55408 
Go to UniProtKB:  P55408
Entity Groups  
Sequence Clusters30% Identity50% Identity70% Identity90% Identity95% Identity100% Identity
UniProt GroupP55408
Sequence Annotations
Expand
  • Reference Sequence
Small Molecules
Ligands 1 Unique
IDChains Name / Formula / InChI Key2D Diagram3D Interactions
LAE
Query on LAE

Download Ideal Coordinates CCD File 
E [auth A],
F [auth B]
3-OXO-OCTANOIC ACID (2-OXO-TETRAHYDRO-FURAN-3-YL)-AMIDE
C12 H19 N O4
FXCMGCFNLNFLSH-JTQLQIEISA-N
Experimental Data & Validation

Experimental Data

  • Method: X-RAY DIFFRACTION
  • Resolution: 2.00 Å
  • R-Value Free: 0.276 
  • R-Value Work: 0.235 
  • R-Value Observed: 0.235 
  • Space Group: P 1
Unit Cell:
Length ( Å )Angle ( ˚ )
a = 56.9α = 94.87
b = 62.48β = 110.45
c = 65.5γ = 99.17
Software Package:
Software NamePurpose
CNSrefinement
CrystalCleardata collection
d*TREKdata reduction
d*TREKdata scaling
PHASERphasing

Structure Validation

View Full Validation Report


Ligand Structure Quality Assessment 


Entry History 

Deposition Data

Revision History  (Full details and data files)

  • Version 1.0: 2007-09-25
    Type: Initial release
  • Version 1.1: 2011-07-13
    Changes: Source and taxonomy, Version format compliance
  • Version 1.2: 2023-08-30
    Changes: Data collection, Database references, Derived calculations, Refinement description