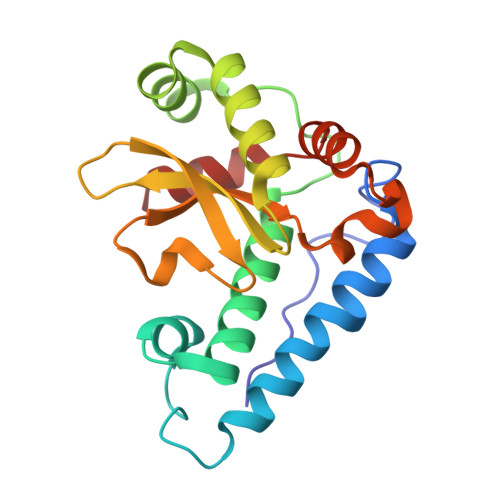
How Can a Single Second Sphere Amino Acid Substitution Cause Reduction Midpoint Potential Changes of Hundreds of Millivolts?
Yikilmaz, E., Porta, J., Grove, L.E., Vahedi-Faridi, A., Bronshteyn, Y., Brunold, T.C., Borgstahl, G.E., Miller, A.F.(2007) J Am Chem Soc 129: 9927-9940
- PubMed: 17628062
- DOI: https://doi.org/10.1021/ja069224t
- Primary Citation of Related Structures:
2NYB - PubMed Abstract:
The active site metal ion of superoxide dismutase (SOD) is reduced and reoxidized as it disproportionates superoxide to dioxygen and hydrogen peroxide. Thus, the reduction midpoint potential (Em) is a critical determinant of catalytic activity. In E. coli Fe-containing SOD (FeSOD), reduction of Fe3+ is accompanied by protonation of a coordinated OH-, to produce Fe2+ coordinated by H2O. The coordinated solvent's only contact with the protein beyond the active site is a conserved Gln residue. Mutation of this Gln to His or Glu resulted in elevation of the Em by 220 mV and more than 660 mV, respectively [Yikilmaz et al., Biochemistry 2006, 45, 1151-1161], despite the fact that overall protein structure was preserved, His is a chemically conservative replacement for Gln, and neutral Glu is isostructural and isoelectronic with Gln. Therefore, we have investigated several possible bases for the elevated Em's, including altered Fe electronic structure, altered active site electrostatics, altered H-bonding and altered redox-coupled proton transfer. Using EPR, MCD, and NMR spectroscopies, we find that the active site electronic structures of the two mutants resemble that of the WT enzyme, for both oxidation states, and Q69E-FeSOD's apparent deviation from WT-like Fe3+ coordination in the oxidized state can be explained by increased affinity for a small anion. Spontaneous coordination of an exogenous anion can only stabilize oxidized Q69E-Fe3+SOD and, therefore, cannot account for the increased Em of Q69E FeSOD. WT-like anion binding affinities and active site pK's indicate that His69 of Q69H-FeSOD is neutral in both oxidation states, like Gln69 of WT-FeSOD, whereas Glu69 appears to be neutral in the oxidized state but ionized in the reduced state of Q69E-FeSOD. A 1.1 A resolution crystal structure of Q69E-Fe2+SOD indicates that Glu69 accepts a strong H-bond from coordinated solvent in the reduced state, in contrast to the case in WT-FeSOD where Gln69 donates an H-bond. These data and DFT calculations lead to the proposal that the elevated Em of Q69E-FeSOD can be substantially explained by (1) relief from enforced H-bond donation in the reduced state, (2) Glu69's capacity to provide a proton for proton-coupled Fe3+ reduction, and (3) strong hydrogen bond acceptance in the reduced state, which stabilizes coordinated H2O. Our results thus support the hypothesis that the protein matrix can apply significant redox tuning via its influence over redox-coupled proton transfer and the energy associated with it.
- Department of Chemistry, University of Kentucky, Lexington, KY 40506-0055, USA.
Organizational Affiliation:


