Crystal structure of the human GINS complex
Choi, J.M., Lim, H.S., Kim, J.J., Song, O.K., Cho, Y.(2007) Genes Dev 21: 1316-1321
- PubMed: 17545466 Search on PubMedSearch on PubMed Central
- DOI: https://doi.org/10.1101/gad.1548107
- Primary Citation Related Structures:
2EHO - PubMed Abstract:
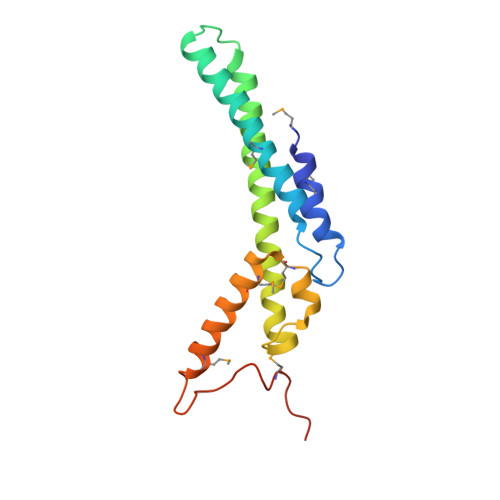
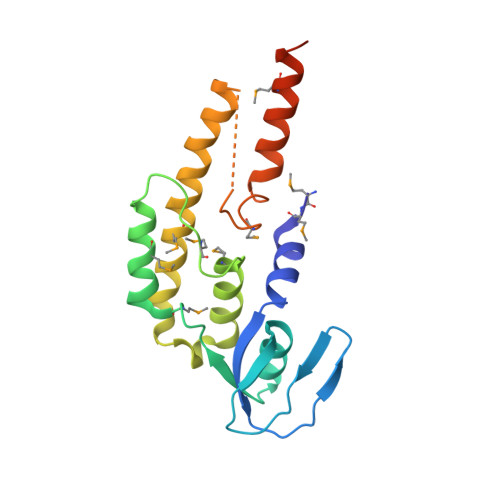
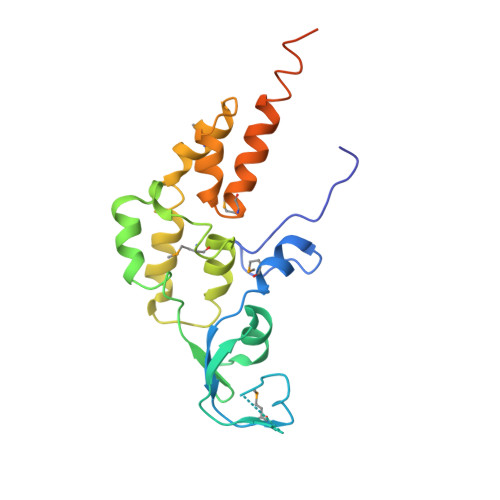
The GINS complex mediates the assembly of the MCM2-7 (minichromosome maintenance) complex with proteins in a replisome progression complex. The eukaryotic GINS complex is composed of Sld5, Psf1, Psf2, and Psf3, which must be assembled for cell proliferation. We determined the crystal structure of the human GINS complex: GINS forms an elliptical shape with a small central channel. The structures of Sld5 and Psf2 resemble those of Psf1 and Psf3, respectively. In addition, the N-terminal and C-terminal domains of Sld5/Psf1 are permuted in Psf2/Psf3, which suggests that the four proteins have evolved from a common ancestor. Using a structure-based mutational analysis, we identified the functionally critical surface regions of the GINS complex.
- National Creative Initiatives for Structural Biology, Pohang University of Science and Technology, Pohang, Kyung Book 790-784, South Korea.
Organizational Affiliation: