1A02 | pdb_00001a02

STRUCTURE OF THE DNA BINDING DOMAINS OF NFAT, FOS AND JUN BOUND TO DNA


Experimental Data Snapshot

  • Method: X-RAY DIFFRACTION
  • Resolution: 2.70 Å
  • R-Value Free: 
    0.303 (Depositor), 0.300 (DCC) 
  • R-Value Work: 
    0.246 (Depositor), 0.254 (DCC) 
  • R-Value Observed: 
    0.246 (Depositor) 

wwPDB Validation 3D Report Full Report

Validation slider image for 1A02

This is version 1.4 of the entry. See complete history

Literature

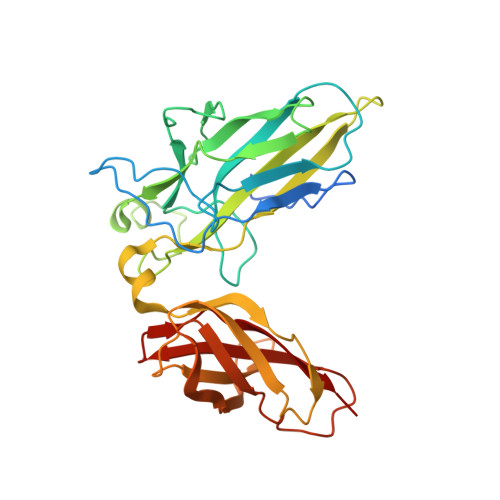
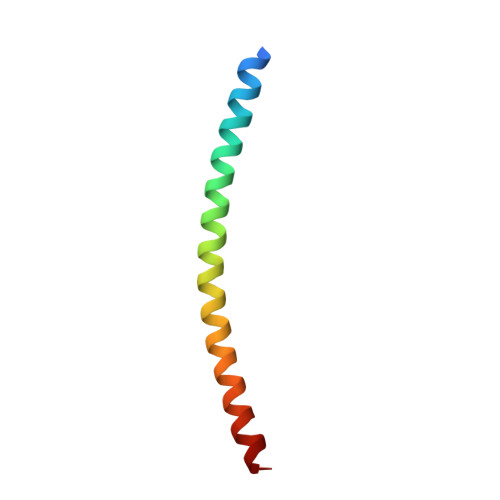
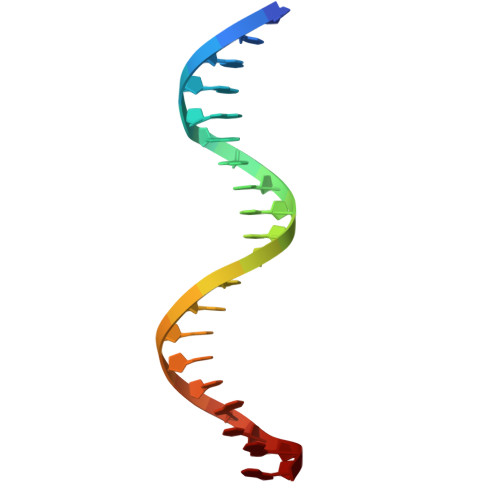
Structure of the DNA-binding domains from NFAT, Fos and Jun bound specifically to DNA.

Chen, L.Glover, J.N.Hogan, P.G.Rao, A.Harrison, S.C.

(1998) Nature 392: 42-48

  • DOI: https://doi.org/10.1038/32100
  • Primary Citation Related Structures: 
    1A02

  • PubMed Abstract: 

    The nuclear factor of activated T cells (NFAT) and the AP-1 heterodimer, Fos-Jun, cooperatively bind a composite DNA site and synergistically activate the expression of many immune-response genes. A 2.7-A-resolution crystal structure of the DNA-binding domains of NFAT, Fos and Jun, in a quaternary complex with a DNA fragment containing the distal antigen-receptor response element from the interleukin-2 gene promoter, shows an extended interface between NFAT and AP-1, facilitated by the bending of Fos and DNA. The tight association of the three proteins on DNA creates a continuous groove for the recognition of 15 base pairs.


  • Organizational Affiliation
    • Department of Molecular and Cellular Biology, Harvard University, Cambridge, Massachusetts 02138, USA. lchen@xta1200.harvard.edu

Macromolecule Content 

  • Total Structure Weight: 59.85 kDa 
  • Atom Count: 3,974 
  • Modeled Residue Count: 425 
  • Deposited Residue Count: 453 
  • Unique protein chains: 3
  • Unique nucleic acid chains: 2

Macromolecules


Find similar proteins by:|  3D Structure
Entity ID: 3
MoleculeChains  Sequence LengthOrganismDetailsImage
NUCLEAR FACTOR OF ACTIVATED T CELLSC [auth N]301Homo sapiensMutation(s): 0 
Gene Names: NFAT1
UniProt & NIH Common Fund Data Resources
Find proteins for Q13469 (Homo sapiens)
Explore Q13469 
Go to UniProtKB:  Q13469
PHAROS:  Q13469
GTEx:  ENSG00000101096 
Entity Groups
Sequence Clusters30% Identity50% Identity70% Identity90% Identity95% Identity100% Identity
UniProt GroupQ13469
Sequence Annotations
Expand
Reference Sequence
Find similar proteins by:|  3D Structure
Entity ID: 4
MoleculeChains  Sequence LengthOrganismDetailsImage
AP-1 FRAGMENT FOSD [auth F]56Homo sapiensMutation(s): 2 
UniProt & NIH Common Fund Data Resources
Find proteins for P01100 (Homo sapiens)
Explore P01100 
Go to UniProtKB:  P01100
PHAROS:  P01100
GTEx:  ENSG00000170345 
Entity Groups
Sequence Clusters30% Identity50% Identity70% Identity90% Identity95% Identity100% Identity
UniProt GroupP01100
Sequence Annotations
Expand
Reference Sequence
Find similar proteins by:|  3D Structure
Entity ID: 5
MoleculeChains  Sequence LengthOrganismDetailsImage
AP-1 FRAGMENT JUNE [auth J]56Homo sapiensMutation(s): 2 
UniProt & NIH Common Fund Data Resources
Find proteins for P05412 (Homo sapiens)
Explore P05412 
Go to UniProtKB:  P05412
PHAROS:  P05412
GTEx:  ENSG00000177606 
Entity Groups
Sequence Clusters30% Identity50% Identity70% Identity90% Identity95% Identity100% Identity
UniProt GroupP05412
Sequence Annotations
Expand
Reference Sequence
Find similar nucleic acids by:  Sequence
Entity ID: 1
MoleculeChains LengthOrganismImage
DNA (5'-D(*DTP*DTP*DGP*DGP*DAP*DAP*DAP*DAP*DTP*DTP*DTP*DGP*DTP*DTP*DTP*DCP*DAP*DTP*DAP*DG)-3')20N/A
Sequence Annotations
Expand
Reference Sequence
Find similar nucleic acids by:  Sequence
Entity ID: 2
MoleculeChains LengthOrganismImage
DNA (5'-D(*DAP*DAP*DCP*DTP*DAP*DTP*DGP*DAP*DAP*DAP*DCP*DAP*DAP*DAP*DTP*DTP*DTP*DTP*DCP*DC)-3')20N/A
Sequence Annotations
Expand
Reference Sequence

Experimental Data & Validation

Experimental Data

  • Method: X-RAY DIFFRACTION
  • Resolution: 2.70 Å
  • R-Value Free:  0.303 (Depositor), 0.300 (DCC) 
  • R-Value Work:  0.246 (Depositor), 0.254 (DCC) 
  • R-Value Observed: 0.246 (Depositor) 
Space Group: P 1 21 1
Unit Cell:
Length ( Å )Angle ( ˚ )
a = 64.66α = 90
b = 85.46β = 112.03
c = 83.37γ = 90
Software Package:
Software NamePurpose
CCP4model building
X-PLORmodel building
X-PLORrefinement
DENZOdata reduction
SCALEPACKdata scaling
CCP4phasing
X-PLORphasing

Structure Validation

View Full Validation Report


Entry History 

Deposition Data

Revision History  (Full details and data files)

  • Version 1.0: 1998-05-27
    Type: Initial release
  • Version 1.1: 2008-05-22
    Changes: Version format compliance
  • Version 1.2: 2011-07-13
    Changes: Version format compliance
  • Version 1.3: 2021-11-03
    Changes: Database references
  • Version 1.4: 2024-02-07
    Changes: Data collection