3IHL

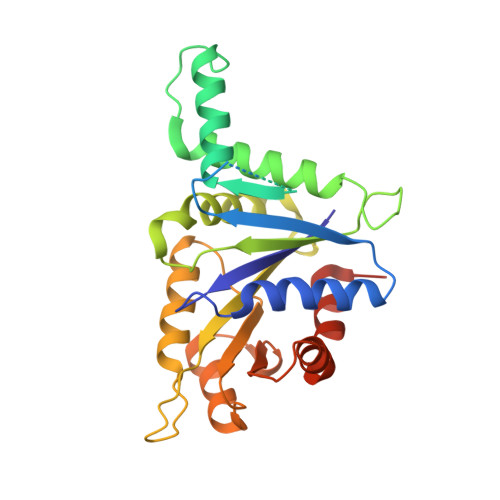
Human CTPS2 crystal structure


Experimental Data Snapshot

  • Method: X-RAY DIFFRACTION
  • Resolution: 2.80 Å
  • R-Value Free: 0.232 
  • R-Value Work: 0.203 
  • R-Value Observed: 0.205 

wwPDB Validation   3D Report Full Report


Ligand Structure Quality Assessment 


This is version 1.3 of the entry. See complete history


Macromolecules
Find similar proteins by:  (by identity cutoff)  |  3D Structure
Entity ID: 1
MoleculeChains Sequence LengthOrganismDetailsImage
CTP synthase 2
A, B
282Homo sapiensMutation(s): 0 
Gene Names: CTPS2
EC: 6.3.4.2
UniProt & NIH Common Fund Data Resources
Find proteins for Q9NRF8 (Homo sapiens)
Explore Q9NRF8 
Go to UniProtKB:  Q9NRF8
PHAROS:  Q9NRF8
GTEx:  ENSG00000047230 
Entity Groups  
Sequence Clusters30% Identity50% Identity70% Identity90% Identity95% Identity100% Identity
UniProt GroupQ9NRF8
Sequence Annotations
Expand
  • Reference Sequence
Experimental Data & Validation

Experimental Data

  • Method: X-RAY DIFFRACTION
  • Resolution: 2.80 Å
  • R-Value Free: 0.232 
  • R-Value Work: 0.203 
  • R-Value Observed: 0.205 
  • Space Group: P 62 2 2
Unit Cell:
Length ( Å )Angle ( ˚ )
a = 168.25α = 90
b = 168.25β = 90
c = 132γ = 120
Software Package:
Software NamePurpose
ADSCdata collection
PHASERphasing
REFMACrefinement
XDSdata reduction
XSCALEdata scaling

Structure Validation

View Full Validation Report


Ligand Structure Quality Assessment 


Entry History 

Revision History  (Full details and data files)

  • Version 1.0: 2009-10-13
    Type: Initial release
  • Version 1.1: 2011-07-13
    Changes: Advisory, Refinement description, Version format compliance
  • Version 1.2: 2018-01-24
    Changes: Structure summary
  • Version 1.3: 2023-09-06
    Changes: Data collection, Database references, Derived calculations, Refinement description