


Crystal structure of reduced AtFKBP13
Gopalan, G., Swaminthan, K., Luan, S., Battaile, K.P.To be published.
Experimental Data Snapshot
wwPDB Validation 3D Report Full Report

Entity ID: 1 | |||||
|---|---|---|---|---|---|
| Molecule | Chains | Sequence Length | Organism | Details | Image |
| FKBP-type peptidyl-prolyl cis-trans isomerase 3 | 129 | Arabidopsis thaliana | Mutation(s): 0 Gene Names: AtFKBP13 EC: 5.2.1.8 | 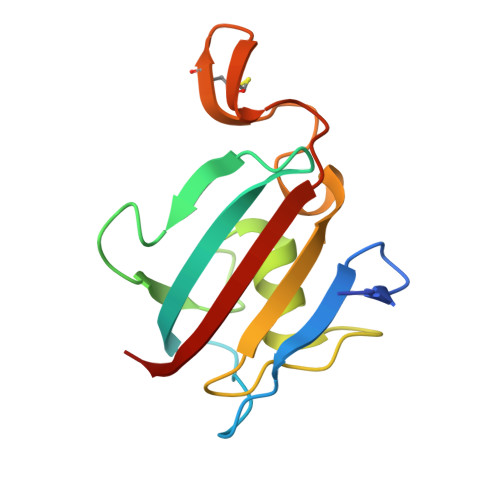 | |
UniProt | |||||
Find proteins for Q9SCY2 (Arabidopsis thaliana) Explore Q9SCY2 Go to UniProtKB: Q9SCY2 | |||||
Entity Groups | |||||
| Sequence Clusters | 30% Identity50% Identity70% Identity90% Identity95% Identity100% Identity | ||||
| UniProt Group | Q9SCY2 | ||||
Sequence AnnotationsExpand | |||||
| |||||
| Length ( Å ) | Angle ( ˚ ) |
|---|---|
| a = 88.898 | α = 90 |
| b = 125.753 | β = 90 |
| c = 119.424 | γ = 90 |
| Software Name | Purpose |
|---|---|
| DENZO | data reduction |
| SCALEPACK | data scaling |
| CCP4 | model building |
| CNS | refinement |
| CCP4 | phasing |
RCSB PDB (citation) is hosted by
RCSB PDB is a member of the

