MAD Phasing Strategies Explored with a Brominated Oligonucleotide Crystal at 1.65A Resolution.
Peterson, M.R., Harrop, S.J., McSweeney, S.M., Leonard, G.A., Thompson, A.W., Hunter, W.N., Helliwell, J.R.(1996) J Synchrotron Radiat 3: 24-34
- PubMed: 16702655
- DOI: https://doi.org/10.1107/S0909049595013288
- Primary Citation of Related Structures:
242D - PubMed Abstract:
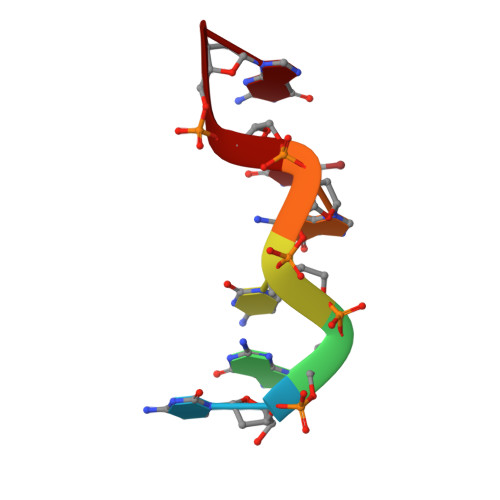
The crystal structure of a brominated oligonucleotide d(CGCG(Br)CG), chemical formula C(114)N(48)O(68)P(10)Br(2), has been analysed by multiwavelength anomalous dispersion (MAD) methods. The oligonucleotide crystallizes in space group P2(1)2(1)2(1) with a = 17.97, b = 30.98, c = 44.85 A, alpha = beta = gamma 90 degrees . Data to a resolution of 1.65 A were collected at four wavelengths about the K-absorption edge of the bromine atom (lambda(1) = 0.9323 A, a reference wavelength at the long-wavelength side of the edge; lambda(2) = 0.9192 A, at the absorption-edge inflection point; lambda(3) = 0.9185 A, at the ;white line' absorption maximum; lambda(4) = 0.8983 A, a reference wavelength at the short-wavelength side) using synchrotron radiation at Station PX9.5, SRS, Daresbury. Multiwavelength data could be collected on a single-crystal as the sample was radiation stable. Anomalous and dispersive Patterson maps were readily interpretable to give the bromine anomalous scatterer positions. Phase calculations to 1.65 A, resolution, using all four wavelengths, gave a figure of merit of 0.825 for 2454 reflections. The electron-density map was readily interpretable showing excellent connectivity for the sugar/phosphate backbone and each base was easily characterized. The two nucleotide strands paired up as expected in an antiparallel Watson-Crick-type manner. The structure was refined to 1.65 A using all the data (R-factor = 17.0% based on 3151 reflections, with a data-to-parameter ratio of 2.6). In addition to the four-wavelength analysis, a variety of other phasing strategies, and the associated quality of the resulting electron-density maps, were compared. These included use of either of the reference wavelength data sets in the two possible three-wavelength phasing combinations to assess their relative effectiveness. Moreover, the time dependence upon measuring the Bijvoet differences and its effect upon phasing was also investigated. Finally, the use of only two wavelengths, including Friedel pairs, is demonstrated (the theoretical minimum case); this is of particular interest when considering overall beam time needs and is clearly a feasible experimental strategy, as shown here.