Modulation of succinyl-CoA:3-ketoacid CoA transferase activity by a single amino acid residue in acetate:succinate CoA transferase from Trypanosoma brucei, the causative agent of African sleeping sickness.
Mochizuki, K., Inaoka, D.K., Fukuda, K., Kurasawa, H., Iyoda, K., Nakai, U., Harada, S., Balogun, E.O., Bringaud, F., Boshart, M., Sakura, T., Hirayama, K., Kita, K., Shiba, T.(2026) Protein Sci 35: e70463-e70463
- PubMed: 41556494 Search on PubMedSearch on PubMed Central
- DOI: https://doi.org/10.1002/pro.70463
- Primary Citation Related Structures:
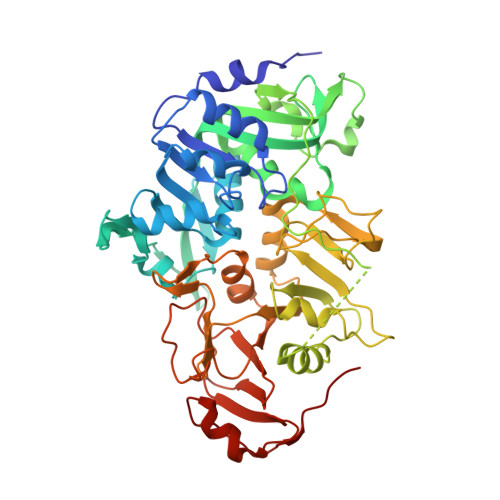
8I3Y, 8I40, 9XMY - PubMed Abstract:
Trypanosomatids are protozoan parasites that remain a global health challenge due to the limited efficacy, safety, and durability of current treatments. Acetate: succinate CoA transferase (ASCT), together with succinyl-CoA synthase (SCS), forms the ASCT/SCS cycle that fuels ATP production and generates acetate, a central metabolic intermediate essential for mitochondrial pathways in these parasites. Although Trypanosoma brucei ASCT (TbASCT) shares 52% amino acid identity with mammalian succinyl-CoA:3-ketoacid CoA transferase (mSCOT), the latter catalyzes a rate-limiting step of ketone body catabolism. Because ASCT and SCOT perform distinct reactions, understanding their mechanistic divergence is crucial for identifying parasite-specific vulnerabilities and advancing selective drug discovery. Here, we report crystal structures of TbASCT bound to all substrates and products, revealing the molecular basis of substrate recognition and catalysis. In solution, TbASCT and mSCOT are homotetrameric and homodimeric, respectively. Despite similar monomer fold, the substrate-binding sites and catalytic mechanisms by which these two enzymes mediate different reactions remain unknown. Site-directed mutagenesis demonstrated that residues Arg162, Leu377, and Asp62 govern tetramer assembly, CoA binding, and acquisition of SCOT activity, respectively. Mutation of Leu377 abolished ASCT activity, while Arg162 mutant produced ASCT-active dimers with a 10-fold increase in SCOT/ASCT activity ratio. Notably, Asp62 mutants exhibited more than 4000-fold increase in this ratio, representing gain-of-function SCOT activity, a reaction absent in TbASCT. These mechanistic insights define the structural determinants that separate ASCT from SCOT function and illuminate opportunities to selectively inhibit ASCT without disrupting host SCOT, thereby informing the development of trypanosomatid-targeted therapeutics.
- Department of Immunogenetics, Institute of Tropical Medicine (NEKKEN), Nagasaki University, Nagasaki, Japan.
Organizational Affiliation: