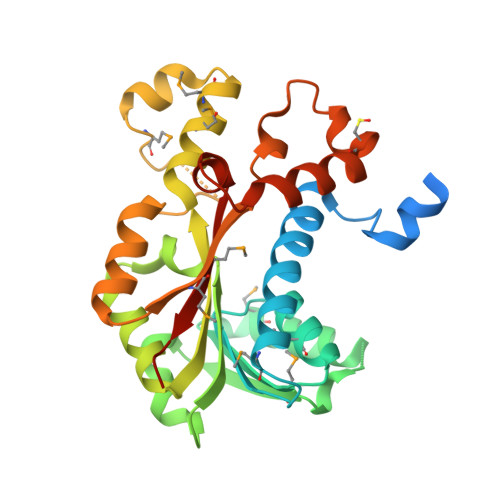
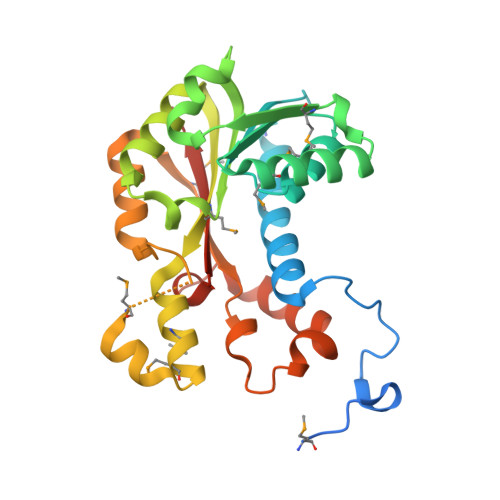
Crystal structure of S-adenosylmethionine-dependent methyltransferase from Escherichia coli in complex with S-adenosylmethionine.
Filippova, E.V., Minasov, G., Shuvalova, L., Kiryukhina, O., Jedrzejczak, R., Joachimiak, A., Anderson, W.F.To be published.