Structural interactions dictate the kinetics of macrophage migration inhibitory factor inhibition by different cancer-preventive isothiocyanates.
Crichlow, G.V., Fan, C., Keeler, C., Hodsdon, M., Lolis, E.J.(2012) Biochemistry 51: 7506-7514
- PubMed: 22931430 Search on PubMedSearch on PubMed Central
- DOI: https://doi.org/10.1021/bi3005494
- Primary Citation Related Structures:
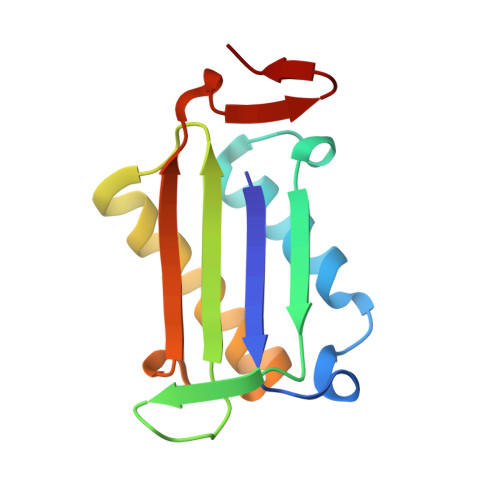
3SMB, 3SMC - PubMed Abstract:
Regulation of cellular processes by dietary nutrients is known to affect the likelihood of cancer development. One class of cancer-preventive nutrients, isothiocyanates (ITCs), derived from the consumption of cruciferous vegetables, is known to have various effects on cellular biochemistry. One target of ITCs is macrophage migration inhibitory factor (MIF), a widely expressed protein with known inflammatory, pro-tumorigenic, pro-angiogenic, and anti-apoptotic properties. MIF is covalently inhibited by a variety of ITCs, which in part may explain how they exert their cancer-preventive effects. We report the crystallographic structures of human MIF bound to phenethylisothiocyanate and to l-sulforaphane (dietary isothiocyanates derived from watercress and broccoli, respectively) and correlate structural features of these two isothiocyanates with their second-order rate constants for MIF inactivation. We also characterize changes in the MIF structure using nuclear magnetic resonance heteronuclear single-quantum coherence spectra of these complexes and observe many changes at the subunit interface. While a number of chemical shifts do not change, many of those that change do not have features similar in magnitude or direction for the two isothiocyanates. The difference in the binding modes of these two ITCs provides a means of using structure-activity relationships to reveal insights into MIF biological interactions. The results of this study provide a framework for the development of therapeutics that target MIF.
- Department of Pharmacology, Yale University School of Medicine, New Haven, CT 06510, USA.
Organizational Affiliation: