Crystal structure of Crocus vernus class IIIb chitinase: in silico ligand-binding studies and in vitro antifungal assay.
Saeed, A., Khaliq, B., Iqbal, S., Mehmood, S., Betzel, C., Akrem, A.(2026) Acta Crystallogr F Struct Biol Commun 82: 14-22
- PubMed: 41325030 Search on PubMed
- DOI: https://doi.org/10.1107/S2053230X25009720
- Primary Citation Related Structures:
3SIM - PubMed Abstract:
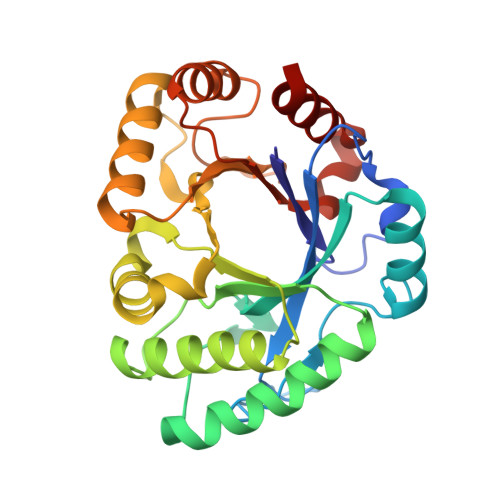
Plant chitinases are found in different organs such as stems, seeds, flowers, corms, tubers and bulbs. In this study, we report the crystal structure of the class IIIb chitinase from Crocus vernus (L.) Hill corms and a thorough comparative analysis with other plant chitinases, especially focusing on molecular-docking interactions between the protein and ligands (allosamidin and chitin oligomer). The C. vernus chitinase (CvChi; PDB entry 3sim) structure has been refined to a crystallographic R factor of 15.5% at a resolution of 2.1 Å. The asymmetric unit is comprised of two chains with 550 residues and 406 water molecules. CvChi has a (β/α) 8 -barrel fold and the catalytic residues of CvChi (Asp123, Asp125 and Glu127) are directly located in the cavity of the barrel. CvChi belongs to the GH18 chitinase family and showed 50% and 16% sequence identity to GH18 chitinases from the fern Pteris ryukyuensis (PrChiA-cat; PDB entry 4rl3) and Hevea brasiliensis (hevamine; PDB entry 1llo), respectively. Structural alignment of the C α atoms of CvChi with PDB entries 7xmh, 4rl3 and 1llo showed r.m.s.d. values of 0.547, 0.897 and 3.8 Å, respectively. Interestingly, two loops (L2 and L3) important for sugar cleavage are larger in CvChi compared with both PDB entries 4rl3 and 1llo. The affinity of CvChi towards allosamidin is lower than those of other GH18 chitinases. Molecular docking revealed that several hydrogen bonds found in the crystal structure of the hevamine-allosamidin complex were missing in the modeled structure of the CvChi-allosamidin complex. The active residues DXDXE of CvChi form a hydrogen bond to allosamidin, compared with two hydrogen bonds in PrChiA-cat. However, CvChi exhibits higher affinity for the chitin oligomer (GlcNAc) 4 , with a lower binding energy of -6.3 kcal mol -1 . Purified CvChi showed maximum endochitinase activity at concentrations of 500 and 1000 ng per assay. CvChi exhibited an antifungal effect against the phytopathogenic fungus Fusarium oxysporum at 500 µg per well, inhibiting about half of the fungal growth.
- The Hamburg Centre for Ultrafast Imaging, Laboratory for Structural Biology of Infection and Inflammation, c/o DESY, University of Hamburg, Building 22a, Notkestrasse 85, 22607 Hamburg, Germany.
Organizational Affiliation: