


a single amino-acid dictates the dynamics of the switch between active and inactive C-Src conformation
Boubeva, R., Pernot, L., Cristiani, A., Moretti, L., Berteotti, A., Perozzo, R., Gervasio, F., Scapozza, L.To be published.
Experimental Data Snapshot
Starting Model: experimental
View more details
Entity ID: 1 | |||||
|---|---|---|---|---|---|
| Molecule | Chains | Sequence Length | Organism | Details | Image |
| Proto-oncogene tyrosine-protein kinase Src | 286 | Gallus gallus | Mutation(s): 1 Gene Names: SRC EC: 2.7.10.2 | 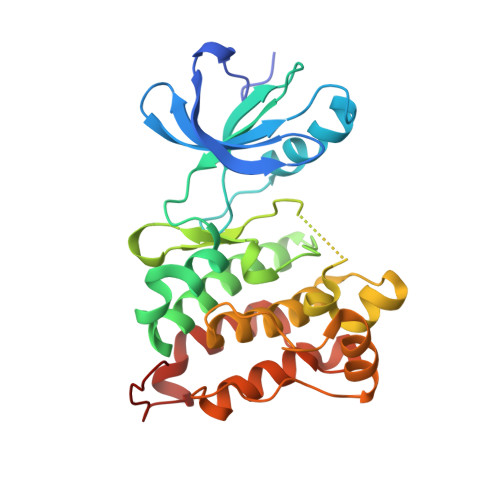 | |
UniProt | |||||
Entity Groups | |||||
| Sequence Clusters | 30% Identity50% Identity70% Identity90% Identity95% Identity100% Identity | ||||
| UniProt Group | P00523 | ||||
Sequence AnnotationsExpand | |||||
Reference Sequence | |||||
| Ligands 3 Unique | |||||
|---|---|---|---|---|---|
| ID | Chains | Name / Formula / InChI Key | 2D Diagram | 3D Interactions | |
| STI Download:Ideal Coordinates CCD File | C [auth A], F [auth B] | 4-(4-METHYL-PIPERAZIN-1-YLMETHYL)-N-[4-METHYL-3-(4-PYRIDIN-3-YL-PYRIMIDIN-2-YLAMINO)-PHENYL]-BENZAMIDE C29 H31 N7 O KTUFNOKKBVMGRW-UHFFFAOYSA-N |  | ||
| GOL Download:Ideal Coordinates CCD File | E [auth A] | GLYCEROL C3 H8 O3 PEDCQBHIVMGVHV-UHFFFAOYSA-N |  | ||
| ACT Download:Ideal Coordinates CCD File | D [auth A] | ACETATE ION C2 H3 O2 QTBSBXVTEAMEQO-UHFFFAOYSA-M |  | ||
| Length ( Å ) | Angle ( ˚ ) |
|---|---|
| a = 41.895 | α = 79.16 |
| b = 63.426 | β = 90.02 |
| c = 74.145 | γ = 90.19 |
| Software Name | Purpose |
|---|---|
| PHASER | phasing |
| PHENIX | refinement |
| MOSFLM | data reduction |
| SCALA | data scaling |


