1ZTP

X-ray structure of gene product from homo sapiens Hs.433573


Experimental Data Snapshot

  • Method: X-RAY DIFFRACTION
  • Resolution: 2.50 Å
  • R-Value Free: 0.245 
  • R-Value Work: 0.188 
  • R-Value Observed: 0.191 

wwPDB Validation   3D Report Full Report


This is version 1.3 of the entry. See complete history

Re-refinement Note

A newer entry is available that reflects an alternative modeling of the original data: 2Q4K


Literature

The structure at 2.5 A resolution of human basophilic leukemia-expressed protein BLES03.

Bitto, E.Bingman, C.A.Robinson, H.Allard, S.T.Wesenberg, G.E.Phillips, G.N.

(2005) Acta Crystallogr Sect F Struct Biol Cryst Commun 61: 812-817

  • DOI: https://doi.org/10.1107/S1744309105023845
  • Primary Citation of Related Structures:  
    1ZTP

  • PubMed Abstract: 

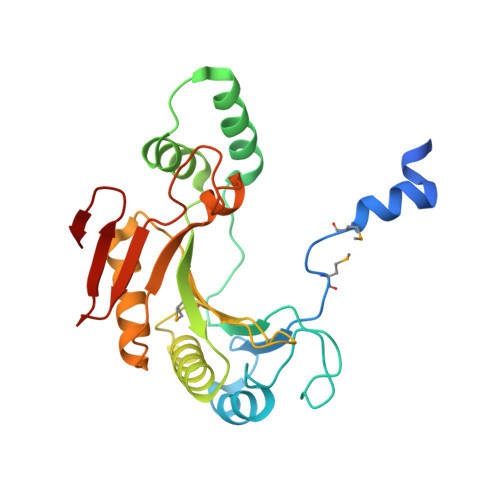
    The crystal structure of the human basophilic leukemia-expressed protein (BLES03, p5326, Hs.433573) was determined by single-wavelength anomalous diffraction and refined to an R factor of 18.8% (Rfree = 24.5%) at 2.5 A resolution. BLES03 shows no detectable sequence similarity to any functionally characterized proteins using state-of-the-art sequence-comparison tools. The structure of BLES03 adopts a fold similar to that of eukaryotic transcription initiation factor 4E (eIF4E), a protein involved in the recognition of the cap structure of eukaryotic mRNA. In addition to fold similarity, the electrostatic surface potentials of BLES03 and eIF4E show a clear conservation of basic and acidic patches. In the crystal lattice, the acidic amino-terminal helices of BLES03 monomers are bound within the basic cavity of symmetry-related monomers in a manner analogous to the binding of mRNA by eIF4E. Interestingly, the gene locus encoding BLES03 is located between genes encoding the proteins DRAP1 and FOSL1, both of which are involved in transcription initiation. It is hypothesized that BLES03 itself may be involved in a biochemical process that requires recognition of nucleic acids.


  • Organizational Affiliation

    Center for Eukaryotic Structural Genomics, Department of Biochemistry, University of Wisconsin-Madison, USA.


Macromolecules
Find similar proteins by:  (by identity cutoff)  |  3D Structure
Entity ID: 1
MoleculeChains Sequence LengthOrganismDetailsImage
Basophilic leukemia expressed protein BLES03
A, B, C
251Homo sapiensMutation(s): 4 
Gene Names: Hs.433573
UniProt & NIH Common Fund Data Resources
Find proteins for Q9H3H3 (Homo sapiens)
Explore Q9H3H3 
Go to UniProtKB:  Q9H3H3
PHAROS:  Q9H3H3
GTEx:  ENSG00000175573 
Entity Groups  
Sequence Clusters30% Identity50% Identity70% Identity90% Identity95% Identity100% Identity
UniProt GroupQ9H3H3
Sequence Annotations
Expand
  • Reference Sequence
Small Molecules
Modified Residues  1 Unique
IDChains TypeFormula2D DiagramParent
MSE
Query on MSE
A, B, C
L-PEPTIDE LINKINGC5 H11 N O2 SeMET
Experimental Data & Validation

Experimental Data

  • Method: X-RAY DIFFRACTION
  • Resolution: 2.50 Å
  • R-Value Free: 0.245 
  • R-Value Work: 0.188 
  • R-Value Observed: 0.191 
  • Space Group: P 21 21 21
Unit Cell:
Length ( Å )Angle ( ˚ )
a = 62.547α = 90
b = 116.809β = 90
c = 123.635γ = 90
Software Package:
Software NamePurpose
DENZOdata reduction
SCALEPACKdata scaling
CNSphasing
RESOLVEphasing
REFMACrefinement
PDB_EXTRACTdata extraction
ARP/wARPmodel building

Structure Validation

View Full Validation Report


Entry History 

Revision History  (Full details and data files)

  • Version 1.0: 2005-06-14
    Type: Initial release
  • Version 1.1: 2008-02-01
    Changes: Version format compliance
  • Version 1.2: 2011-07-13
    Changes: Derived calculations, Version format compliance
  • Version 1.3: 2017-10-11
    Changes: Refinement description