1XIW

Crystal structure of human CD3-e/d dimer in complex with a UCHT1 single-chain antibody fragment


Experimental Data Snapshot

  • Method: X-RAY DIFFRACTION
  • Resolution: 1.90 Å
  • R-Value Free: 0.241 
  • R-Value Work: 0.204 
  • R-Value Observed: 0.204 

Starting Model: experimental
View more details

wwPDB Validation   3D Report Full Report


This is version 1.5 of the entry. See complete history


Literature

Crystal structure of a human CD3-epsilon/delta dimer in complex with a UCHT1 single-chain antibody fragment.

Arnett, K.L.Harrison, S.C.Wiley, D.C.

(2004) Proc Natl Acad Sci U S A 101: 16268-16273

  • DOI: https://doi.org/10.1073/pnas.0407359101
  • Primary Citation of Related Structures:  
    1XIW

  • PubMed Abstract: 

    The alpha/beta T cell receptor complex transmits signals from MHC/peptide antigens through a set of constitutively associated signaling molecules, including CD3-epsilon/gamma and CD3-epsilon/delta. We report the crystal structure at 1.9-A resolution of a complex between a human CD3-epsilon/delta ectodomain heterodimer and a single-chain fragment of the UCHT1 antibody. CD3-epsilon/delta and CD3-epsilon/gamma share a conserved interface between the Ig-fold ectodomains, with parallel packing of the two G strands. CD3-delta has a more electronegative surface and a more compact Ig fold than CD3-gamma; thus, the two CD3 heterodimers have distinctly different molecular surfaces. The UCHT1 antibody binds near an acidic region of CD3-epsilon opposite the dimer interface, occluding this region from direct interaction with the TCR. This immunodominant epitope may be a uniquely accessible surface in the TCR/CD3 complex, because there is overlap between the binding site of the UCHT1 and OKT3 antibodies. Determination of the CD3-epsilon/delta structure completes the set of TCR/CD3 globular ectodomains and contributes information about exposed CD3 surfaces.


  • Organizational Affiliation

    Department of Biological Chemistry and Molecular Pharmacology, Howard Hughes Medical Institute, Harvard Medical School, 250 Longwood Avenue, Boston, MA 02115, USA. arnett@crystal.harvard.edu


Macromolecules
Find similar proteins by:  (by identity cutoff)  |  3D Structure
Entity ID: 1
MoleculeChains Sequence LengthOrganismDetailsImage
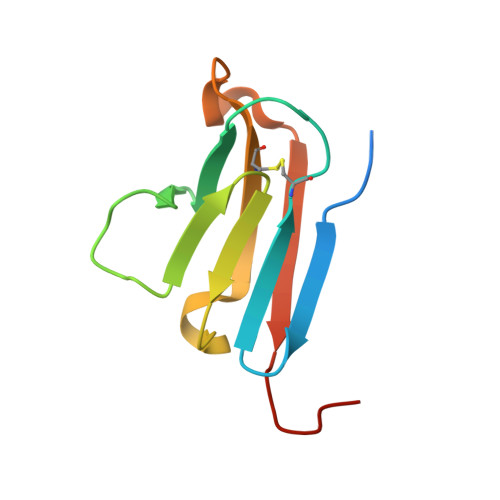
T-cell surface glycoprotein CD3 epsilon chain
A, E
105Homo sapiensMutation(s): 0 
Gene Names: CD3ET3E
UniProt & NIH Common Fund Data Resources
Find proteins for P07766 (Homo sapiens)
Explore P07766 
Go to UniProtKB:  P07766
PHAROS:  P07766
GTEx:  ENSG00000198851 
Entity Groups  
Sequence Clusters30% Identity50% Identity70% Identity90% Identity95% Identity100% Identity
UniProt GroupP07766
Sequence Annotations
Expand
  • Reference Sequence
Find similar proteins by:  (by identity cutoff)  |  3D Structure
Entity ID: 2
MoleculeChains Sequence LengthOrganismDetailsImage
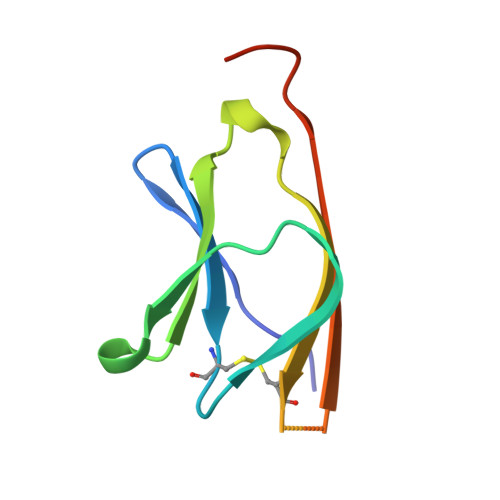
T-cell surface glycoprotein CD3 delta chain
B, F
79Homo sapiensMutation(s): 0 
Gene Names: CD3DT3D
UniProt & NIH Common Fund Data Resources
Find proteins for P04234 (Homo sapiens)
Explore P04234 
Go to UniProtKB:  P04234
PHAROS:  P04234
GTEx:  ENSG00000167286 
Entity Groups  
Sequence Clusters30% Identity50% Identity70% Identity90% Identity95% Identity100% Identity
UniProt GroupP04234
Sequence Annotations
Expand
  • Reference Sequence
Find similar proteins by:  (by identity cutoff)  |  3D Structure
Entity ID: 3
MoleculeChains Sequence LengthOrganismDetailsImage
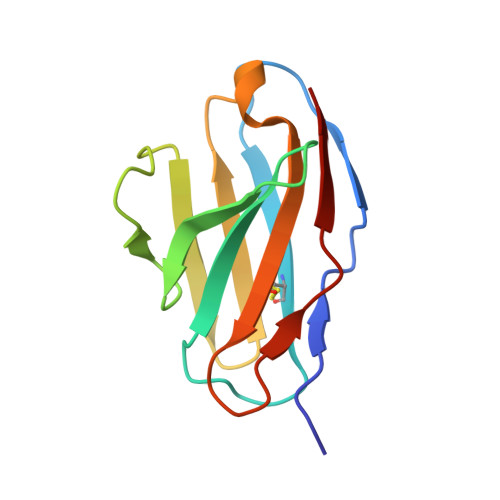
immunoglobulin light chain variable region
C, G
108Mus musculusMutation(s): 0 
Gene Names: UCHT1
Entity Groups  
Sequence Clusters30% Identity50% Identity70% Identity90% Identity95% Identity100% Identity
Sequence Annotations
Expand
  • Reference Sequence
Find similar proteins by:  (by identity cutoff)  |  3D Structure
Entity ID: 4
MoleculeChains Sequence LengthOrganismDetailsImage
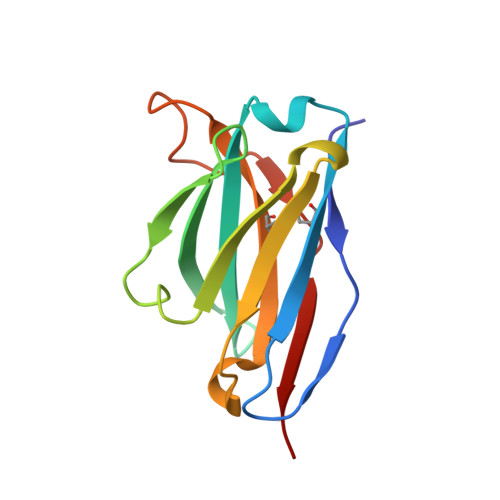
immunoglobulin heavy chain variable region
D, H
122Mus musculusMutation(s): 0 
Gene Names: UCHT1
Entity Groups  
Sequence Clusters30% Identity50% Identity70% Identity90% Identity95% Identity100% Identity
Sequence Annotations
Expand
  • Reference Sequence
Experimental Data & Validation

Experimental Data

  • Method: X-RAY DIFFRACTION
  • Resolution: 1.90 Å
  • R-Value Free: 0.241 
  • R-Value Work: 0.204 
  • R-Value Observed: 0.204 
  • Space Group: P 21 21 21
Unit Cell:
Length ( Å )Angle ( ˚ )
a = 64.874α = 90
b = 79.326β = 90
c = 150.747γ = 90
Software Package:
Software NamePurpose
CNSrefinement
HKL-2000data reduction
SCALEPACKdata scaling
MOLREPphasing

Structure Validation

View Full Validation Report


Entry History 

Deposition Data

Revision History  (Full details and data files)

  • Version 1.0: 2004-11-16
    Type: Initial release
  • Version 1.1: 2008-04-30
    Changes: Version format compliance
  • Version 1.2: 2011-07-13
    Changes: Version format compliance
  • Version 1.3: 2018-01-31
    Changes: Experimental preparation
  • Version 1.4: 2023-08-23
    Changes: Data collection, Database references, Refinement description
  • Version 1.5: 2024-10-30
    Changes: Structure summary