1UWJ

The complex of mutant V599E B-RAF and BAY439006.


Experimental Data Snapshot

  • Method: X-RAY DIFFRACTION
  • Resolution: 3.50 Å
  • R-Value Free: 0.357 
  • R-Value Work: 0.275 
  • R-Value Observed: 0.275 

wwPDB Validation   3D Report Full Report


Ligand Structure Quality Assessment 


This is version 1.2 of the entry. See complete history


Literature

Mechanism of Activation of the Raf-Erk Signaling Pathway by Oncogenic Mutations of B-Raf

Wan, P.T.C.Garnett, M.J.Roe, S.M.Lee, S.Niculescu-Duvaz, D.Good, V.M.Jones, C.M.Marshall, C.J.Springer, C.J.Barford, D.Marais, R.

(2004) Cell 116: 855

  • DOI: https://doi.org/10.1016/s0092-8674(04)00215-6
  • Primary Citation of Related Structures:  
    1UWH, 1UWJ

  • PubMed Abstract: 

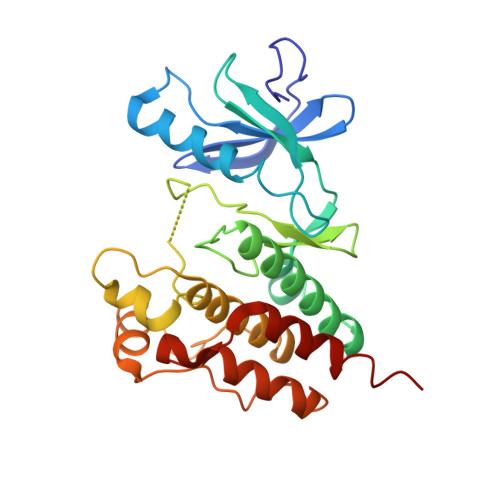
    Over 30 mutations of the B-RAF gene associated with human cancers have been identified, the majority of which are located within the kinase domain. Here we show that of 22 B-RAF mutants analyzed, 18 have elevated kinase activity and signal to ERK in vivo. Surprisingly, three mutants have reduced kinase activity towards MEK in vitro but, by activating C-RAF in vivo, signal to ERK in cells. The structures of wild type and oncogenic V599EB-RAF kinase domains in complex with the RAF inhibitor BAY43-9006 show that the activation segment is held in an inactive conformation by association with the P loop. The clustering of most mutations to these two regions suggests that disruption of this interaction converts B-RAF into its active conformation. The high activity mutants signal to ERK by directly phosphorylating MEK, whereas the impaired activity mutants stimulate MEK by activating endogenous C-RAF, possibly via an allosteric or transphosphorylation mechanism.


  • Organizational Affiliation

    Section of Structural Biology, The Institute of Cancer Research, Chester Beatty Laboratories, 237 Fulham Road, London SW3 6JB, UK.


Macromolecules
Find similar proteins by:  (by identity cutoff)  |  3D Structure
Entity ID: 1
MoleculeChains Sequence LengthOrganismDetailsImage
B-RAF PROTO-ONCOGENE SERINE/THREONINE-PROTEIN KINASE
A, B
276Homo sapiensMutation(s): 1 
EC: 2.7.1.37 (PDB Primary Data), 2.7.11.1 (PDB Primary Data)
UniProt & NIH Common Fund Data Resources
Find proteins for P15056 (Homo sapiens)
Explore P15056 
Go to UniProtKB:  P15056
PHAROS:  P15056
GTEx:  ENSG00000157764 
Entity Groups  
Sequence Clusters30% Identity50% Identity70% Identity90% Identity95% Identity100% Identity
UniProt GroupP15056
Sequence Annotations
Expand
  • Reference Sequence
Small Molecules
Ligands 1 Unique
IDChains Name / Formula / InChI Key2D Diagram3D Interactions
BAX
Query on BAX

Download Ideal Coordinates CCD File 
C [auth A],
D [auth B]
4-{4-[({[4-CHLORO-3-(TRIFLUOROMETHYL)PHENYL]AMINO}CARBONYL)AMINO]PHENOXY}-N-METHYLPYRIDINE-2-CARBOXAMIDE
C21 H16 Cl F3 N4 O3
MLDQJTXFUGDVEO-UHFFFAOYSA-N
Binding Affinity Annotations 
IDSourceBinding Affinity
BAX BindingDB:  1UWJ Ki: min: 22, max: 38 (nM) from 2 assay(s)
Kd: min: 54, max: 540 (nM) from 4 assay(s)
IC50: min: 4.4, max: 7300 (nM) from 29 assay(s)
EC50: 3 (nM) from 1 assay(s)
Experimental Data & Validation

Experimental Data

  • Method: X-RAY DIFFRACTION
  • Resolution: 3.50 Å
  • R-Value Free: 0.357 
  • R-Value Work: 0.275 
  • R-Value Observed: 0.275 
  • Space Group: P 41 21 2
Unit Cell:
Length ( Å )Angle ( ˚ )
a = 97.66α = 90
b = 97.66β = 90
c = 168.07γ = 90
Software Package:
Software NamePurpose
CNSrefinement
MOSFLMdata reduction
SCALAdata scaling
MOLREPphasing

Structure Validation

View Full Validation Report


Ligand Structure Quality Assessment 


Entry History 

Deposition Data

Revision History  (Full details and data files)

  • Version 1.0: 2004-03-19
    Type: Initial release
  • Version 1.1: 2013-01-16
    Changes: Derived calculations, Non-polymer description, Other, Refinement description, Source and taxonomy, Structure summary, Version format compliance
  • Version 1.2: 2018-01-17
    Changes: Structure summary