4HDQ

Crystal Structure of the Ternary Complex of KRIT1 bound to both the Rap1 GTPase and the Heart of Glass (HEG1) cytoplasmic tail


Experimental Data Snapshot

  • Method: X-RAY DIFFRACTION
  • Resolution: 1.95 Å
  • R-Value Free: 0.263 
  • R-Value Work: 0.200 
  • R-Value Observed: 0.203 

wwPDB Validation   3D Report Full Report


Ligand Structure Quality Assessment 


This is version 1.3 of the entry. See complete history


Literature

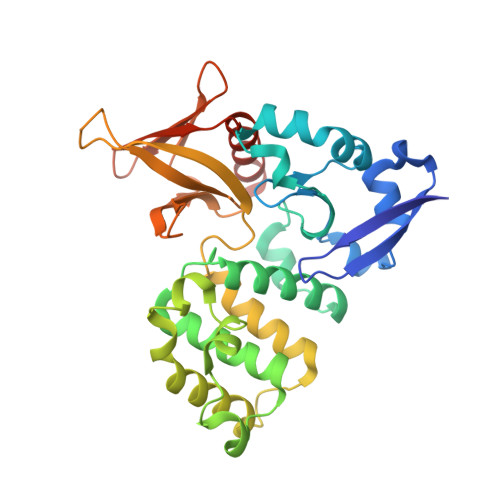
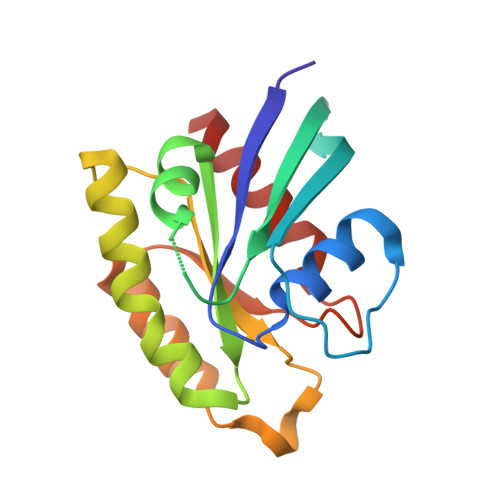
The Structure of the Ternary Complex of Krev Interaction Trapped 1 (KRIT1) Bound to Both the Rap1 GTPase and the Heart of Glass (HEG1) Cytoplasmic Tail.

Gingras, A.R.Puzon-McLaughlin, W.Ginsberg, M.H.

(2013) J Biol Chem 288: 23639-23649

  • DOI: https://doi.org/10.1074/jbc.M113.462911
  • Primary Citation of Related Structures:  
    4HDO, 4HDQ

  • PubMed Abstract: 

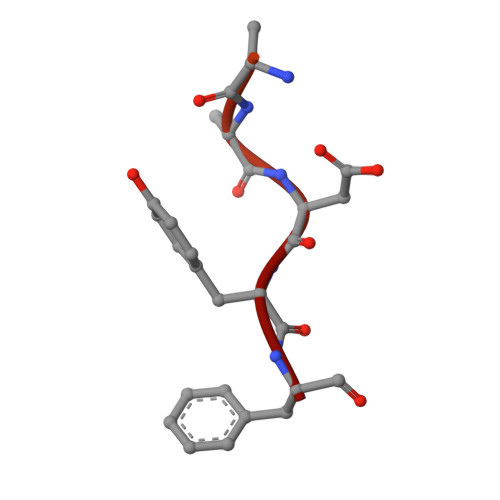
    Loss of function mutation in Krev interaction trapped 1 (KRIT1) causes autosomal dominant familial cerebral cavernous malformations and disrupts cardiovascular development. The biological function of KRIT1 requires that its FERM (band 4.1, ezrin, radixin, moesin) domain physically interact with both the small GTPase Rap1 and the cytoplasmic tail of the Heart of glass (HEG1) membrane anchor. In this study, we show that the KRIT1 FERM domain can bind both Rap1 and HEG1 simultaneously, and we solved the crystal structure of the KRIT1-Rap1-HEG1 ternary complex. Rap1 binds on the surface of the F1 and F2 subdomains, in an interaction that leaves its Switch II region accessible to other potential effectors. HEG1 binds in a hydrophobic pocket at the KRIT1 F1 and F3 interface, and there is no overlap with the Rap1-binding site. Indeed, the affinity of KRIT1 or the KRIT1-Rap1 complex for HEG1 is comparable (Kd = 1.2 and 0.96 μm, respectively) showing that there is no competition between the two sites. Furthermore, analysis of this structure revealed a specific ionic interaction between the F2 lobe of KRIT1 and Rap1 that could explain the remarkable Rap1 specificity of KRIT1. This structural insight enabled design of KRIT1(K570I), a mutant that binds Rap1 with 8-fold lower affinity and exhibits increased binding to HRas. These data show that HEG1 can recruit the Rap1-KRIT complex to the plasma membrane where Rap1's Switch II region remains accessible and reveals an important determinant of KRIT1's specificity for Rap1.


  • Organizational Affiliation

    Department of Medicine, University of California at San Diego, La Jolla, California 92093, USA. agingras@ucsd.edu


Macromolecules
Find similar proteins by:  (by identity cutoff)  |  3D Structure
Entity ID: 1
MoleculeChains Sequence LengthOrganismDetailsImage
Krev interaction trapped protein 1322Homo sapiensMutation(s): 0 
Gene Names: KRIT1CCM1
UniProt & NIH Common Fund Data Resources
Find proteins for O00522 (Homo sapiens)
Explore O00522 
Go to UniProtKB:  O00522
PHAROS:  O00522
GTEx:  ENSG00000001631 
Entity Groups  
Sequence Clusters30% Identity50% Identity70% Identity90% Identity95% Identity100% Identity
UniProt GroupO00522
Sequence Annotations
Expand
  • Reference Sequence
Find similar proteins by:  (by identity cutoff)  |  3D Structure
Entity ID: 2
MoleculeChains Sequence LengthOrganismDetailsImage
Ras-related protein Rap-1b167Homo sapiensMutation(s): 0 
Gene Names: RAP1BOK/SW-cl.11
UniProt & NIH Common Fund Data Resources
Find proteins for P61224 (Homo sapiens)
Explore P61224 
Go to UniProtKB:  P61224
PHAROS:  P61224
GTEx:  ENSG00000127314 
Entity Groups  
Sequence Clusters30% Identity50% Identity70% Identity90% Identity95% Identity100% Identity
UniProt GroupP61224
Sequence Annotations
Expand
  • Reference Sequence
Find similar proteins by:  (by identity cutoff)  |  3D Structure
Entity ID: 3
MoleculeChains Sequence LengthOrganismDetailsImage
Protein HEG homolog 126Homo sapiensMutation(s): 0 
UniProt & NIH Common Fund Data Resources
Find proteins for Q9ULI3 (Homo sapiens)
Explore Q9ULI3 
Go to UniProtKB:  Q9ULI3
PHAROS:  Q9ULI3
GTEx:  ENSG00000173706 
Entity Groups  
Sequence Clusters30% Identity50% Identity70% Identity90% Identity95% Identity100% Identity
UniProt GroupQ9ULI3
Sequence Annotations
Expand
  • Reference Sequence
Experimental Data & Validation

Experimental Data

  • Method: X-RAY DIFFRACTION
  • Resolution: 1.95 Å
  • R-Value Free: 0.263 
  • R-Value Work: 0.200 
  • R-Value Observed: 0.203 
  • Space Group: P 1 21 1
Unit Cell:
Length ( Å )Angle ( ˚ )
a = 57.31α = 90
b = 77.41β = 95.56
c = 58.57γ = 90
Software Package:
Software NamePurpose
dlsdata collection
PHASERphasing
REFMACrefinement
XDSdata reduction
XDSdata scaling

Structure Validation

View Full Validation Report


Ligand Structure Quality Assessment 


Entry History 

Deposition Data

Revision History  (Full details and data files)

  • Version 1.0: 2013-07-10
    Type: Initial release
  • Version 1.1: 2013-07-17
    Changes: Database references
  • Version 1.2: 2013-09-04
    Changes: Database references
  • Version 1.3: 2023-09-20
    Changes: Data collection, Database references, Derived calculations, Refinement description