1JVM

KCSA POTASSIUM CHANNEL WITH TBA (TETRABUTYLAMMONIUM) AND RUBIDIUM


Experimental Data Snapshot

  • Method: X-RAY DIFFRACTION
  • Resolution: 2.80 Å
  • R-Value Free: 0.302 
  • R-Value Work: 0.281 
  • R-Value Observed: 0.290 

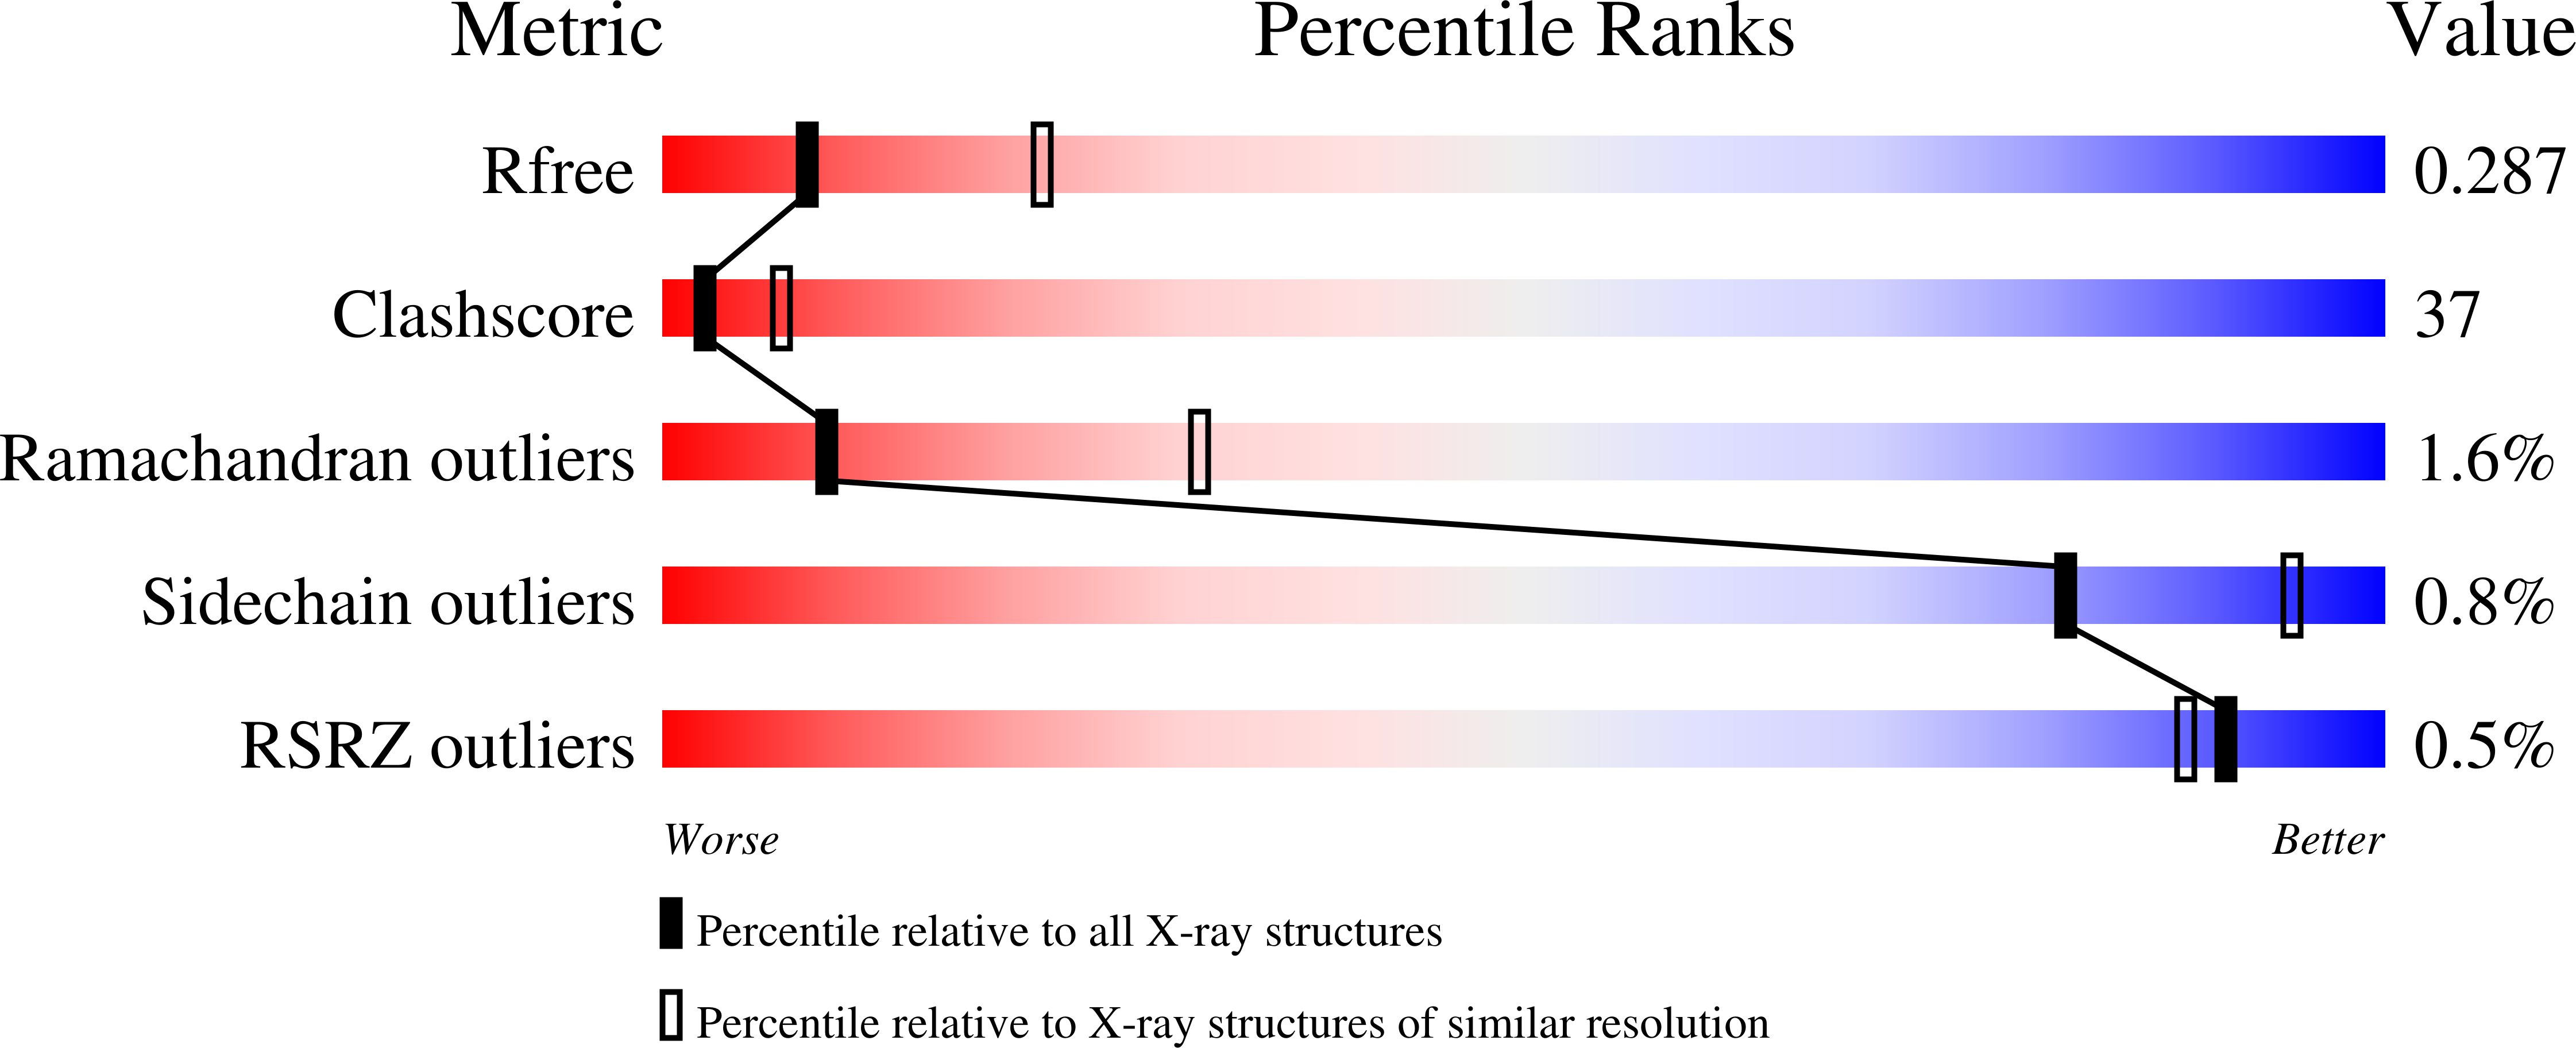
wwPDB Validation   3D Report Full Report


Ligand Structure Quality Assessment 


This is version 1.4 of the entry. See complete history


Literature

Energetic optimization of ion conduction rate by the K+ selectivity filter.

Morais-Cabral, J.H.Zhou, Y.MacKinnon, R.

(2001) Nature 414: 37-42

  • DOI: https://doi.org/10.1038/35102000
  • Primary Citation of Related Structures:  
    1JVM

  • PubMed Abstract: 

    The K+ selectivity filter catalyses the dehydration, transfer and rehydration of a K+ ion in about ten nanoseconds. This physical process is central to the production of electrical signals in biology. Here we show how nearly diffusion-limited rates are achieved, by analysing ion conduction and the corresponding crystallographic ion distribution in the selectivity filter of the KcsA K+ channel. Measurements with K+ and its slightly larger analogue, Rb+, lead us to conclude that the selectivity filter usually contains two K+ ions separated by one water molecule. The two ions move in a concerted fashion between two configurations, K+-water-K+-water (1,3 configuration) and water-K+-water-K+ (2,4 configuration), until a third ion enters, displacing the ion on the opposite side of the queue. For K+, the energy difference between the 1,3 and 2,4 configurations is close to zero, the condition of maximum conduction rate. The energetic balance between these configurations is a clear example of evolutionary optimization of protein function.


  • Organizational Affiliation

    Department of Molecular Biophysics and Biochemistry, Yale University, 260 Whitney Avenue, New Haven, Connecticut 06520, USA.


Macromolecules
Find similar proteins by:  (by identity cutoff)  |  3D Structure
Entity ID: 1
MoleculeChains Sequence LengthOrganismDetailsImage
Voltage-gated potassium channel
A, B, C, D
125Streptomyces lividansMutation(s): 2 
Membrane Entity: Yes 
UniProt
Find proteins for P0A334 (Streptomyces lividans)
Explore P0A334 
Go to UniProtKB:  P0A334
Entity Groups  
Sequence Clusters30% Identity50% Identity70% Identity90% Identity95% Identity100% Identity
UniProt GroupP0A334
Sequence Annotations
Expand
  • Reference Sequence
Experimental Data & Validation

Experimental Data

  • Method: X-RAY DIFFRACTION
  • Resolution: 2.80 Å
  • R-Value Free: 0.302 
  • R-Value Work: 0.281 
  • R-Value Observed: 0.290 
  • Space Group: C 1 2 1
Unit Cell:
Length ( Å )Angle ( ˚ )
a = 129.8α = 90
b = 69.4β = 125.6
c = 112.7γ = 90
Software Package:
Software NamePurpose
CNSrefinement
DENZOdata reduction
SCALEPACKdata scaling
CNSphasing

Structure Validation

View Full Validation Report


Ligand Structure Quality Assessment 


Entry History 

Deposition Data

Revision History  (Full details and data files)

  • Version 1.0: 2001-12-05
    Type: Initial release
  • Version 1.1: 2008-04-27
    Changes: Version format compliance
  • Version 1.2: 2011-07-13
    Changes: Version format compliance
  • Version 1.3: 2021-10-27
    Changes: Database references, Derived calculations
  • Version 1.4: 2023-08-16
    Changes: Data collection, Refinement description