


New Features
Explore Ligand Interactions in 3D
10/11
The Small Molecules section of an entry’s Structure Summary page offers multiple tools for ligand visualization in 2D and 3D.
A new option uses NGL to display the ligand molecule and all residues within 5 Angstrom. The vdW surface of the ligand highlights the occupied volume. The name and number of interacting residues are labeled. From this 3D view, users can access additional ligands in an entry using the Interaction dropdown menu.
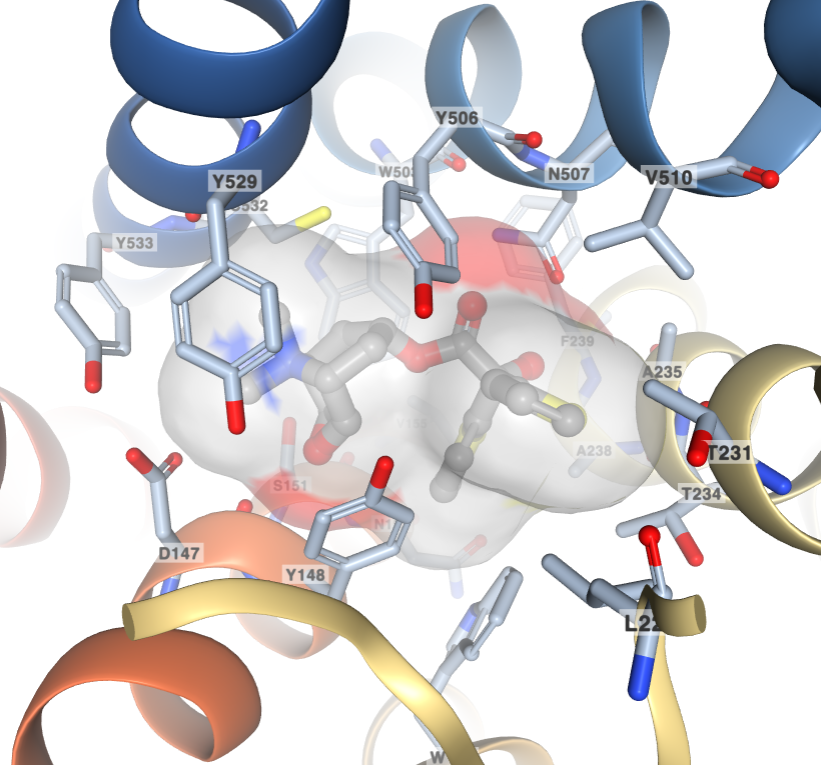 Ligand interaction view of the COPD drug tiotropium (Ligand ID 0HK) bound to the Muscarinic acetylcholine receptor M3 (PDB ID 4U15).
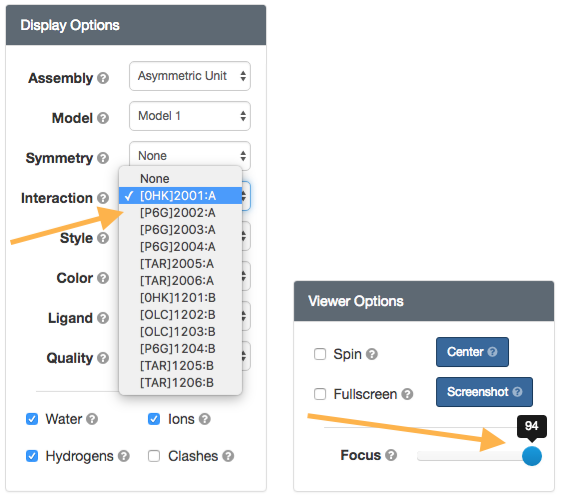 The “Interaction” selection field lists all ligand molecules of the structure. A new slider is available to “Focus” the part of the structure in the center of the screen. A value of 0 shows everything. As values go closer to 100, clipping planes hide more and more parts of the structure in the front and the back.