


LBCATS
Merkl, R., Schlee, S., Heyn, K.To be published.
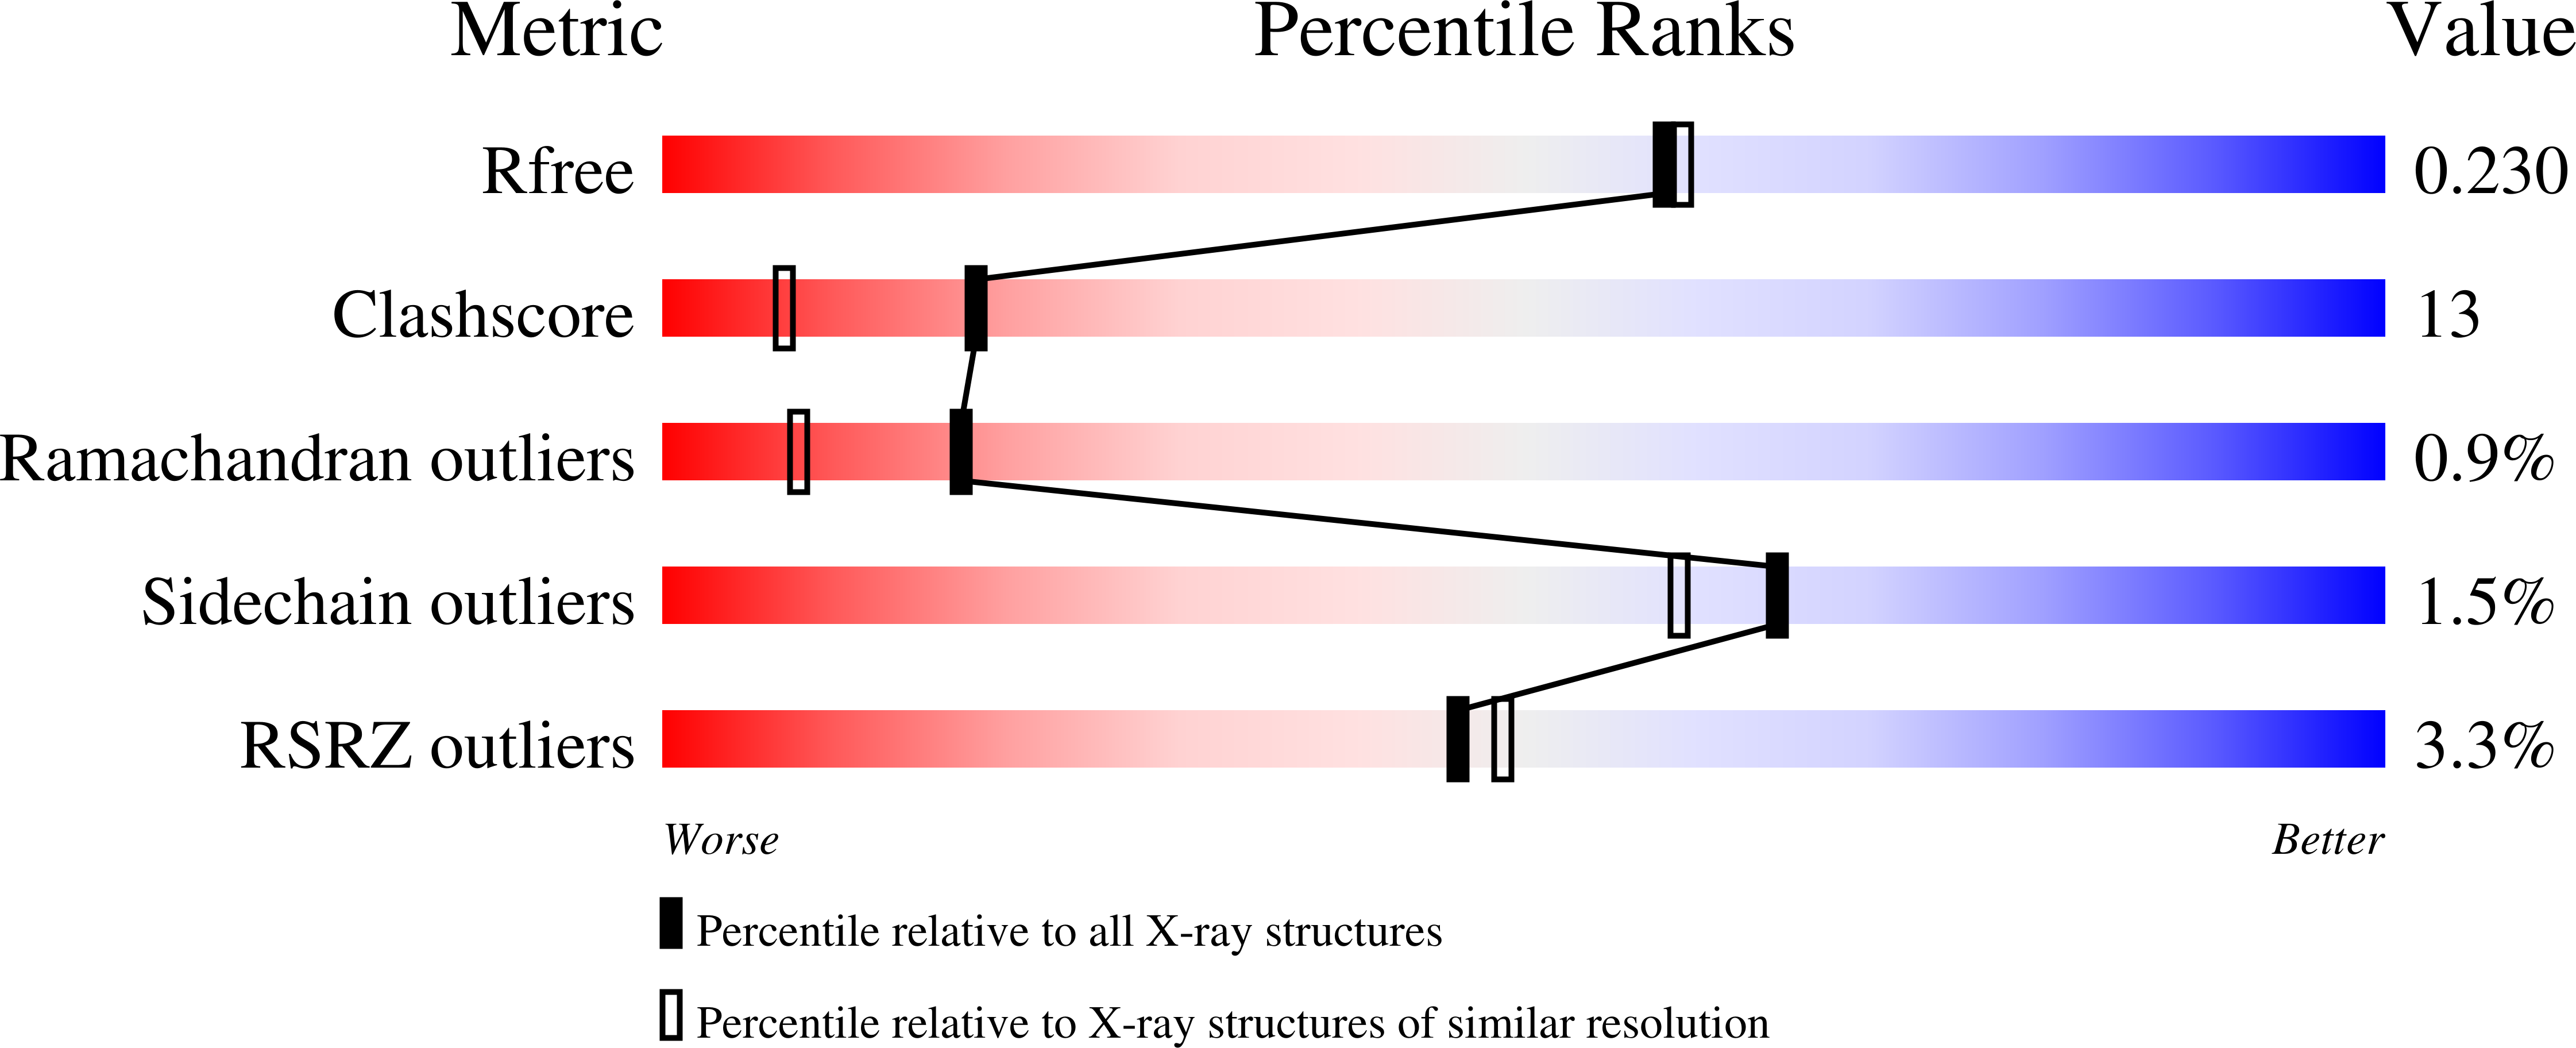
Experimental Data Snapshot
Entity ID: 1 | |||||
|---|---|---|---|---|---|
| Molecule | Chains | Sequence Length | Organism | Details | Image |
| LBCATS-a | 273 | synthetic construct | Mutation(s): 0 | 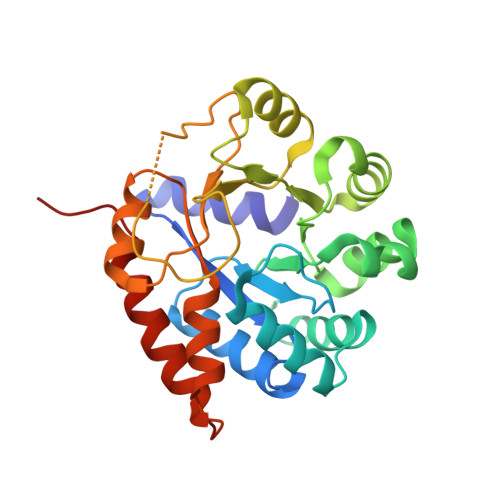 | |
Entity Groups | |||||
| Sequence Clusters | 30% Identity50% Identity70% Identity90% Identity95% Identity100% Identity | ||||
Sequence AnnotationsExpand | |||||
| |||||
Entity ID: 2 | |||||
|---|---|---|---|---|---|
| Molecule | Chains | Sequence Length | Organism | Details | Image |
| LBCA-b | 399 | synthetic construct | Mutation(s): 0 | 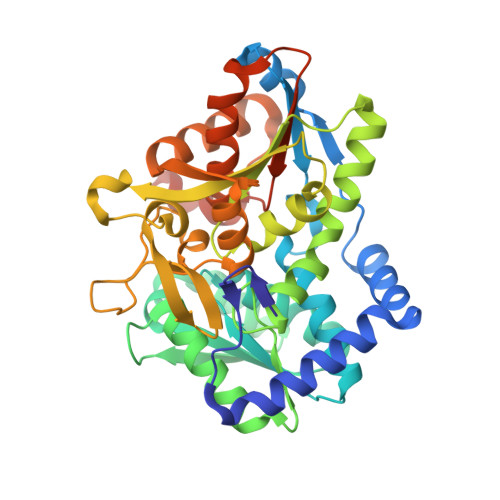 | |
Entity Groups | |||||
| Sequence Clusters | 30% Identity50% Identity70% Identity90% Identity95% Identity100% Identity | ||||
Sequence AnnotationsExpand | |||||
| |||||
| Ligands 3 Unique | |||||
|---|---|---|---|---|---|
| ID | Chains | Name / Formula / InChI Key | 2D Diagram | 3D Interactions | |
| PLP Query on PLP | F [auth B], I [auth D] | PYRIDOXAL-5'-PHOSPHATE C8 H10 N O6 P NGVDGCNFYWLIFO-UHFFFAOYSA-N |  | ||
| G3P Query on G3P | E [auth A], H [auth C] | SN-GLYCEROL-3-PHOSPHATE C3 H9 O6 P AWUCVROLDVIAJX-GSVOUGTGSA-N |  | ||
| NA Query on NA | G [auth B], J [auth D], K [auth D] | SODIUM ION Na FKNQFGJONOIPTF-UHFFFAOYSA-N |  | ||
| Length ( Å ) | Angle ( ˚ ) |
|---|---|
| a = 95.963 | α = 90 |
| b = 162.996 | β = 93.78 |
| c = 78.058 | γ = 90 |
| Software Name | Purpose |
|---|---|
| PHENIX | refinement |
| XDS | data reduction |
| XDS | data scaling |
| PHENIX | phasing |
RCSB PDB (citation) is hosted by
RCSB PDB is a member of the

