4WZB

Crystal Structure of MgAMPPCP-bound Av2-Av1 complex


Experimental Data Snapshot

  • Method: X-RAY DIFFRACTION
  • Resolution: 2.30 Å
  • R-Value Free: 0.255 
  • R-Value Work: 0.204 
  • R-Value Observed: 0.207 

wwPDB Validation   3D Report Full Report


Ligand Structure Quality Assessment 


This is version 1.3 of the entry. See complete history


Literature

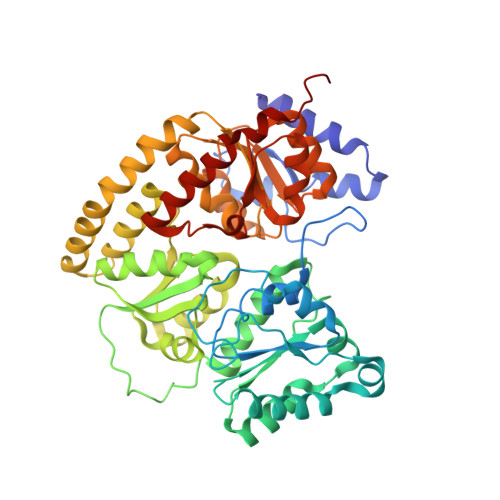
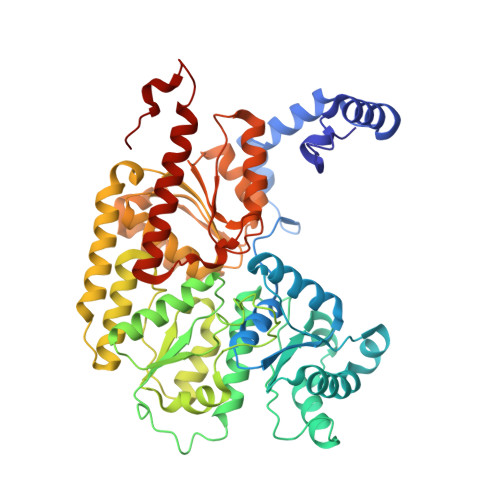
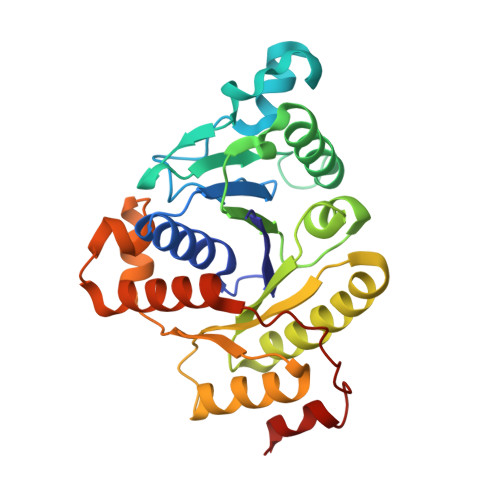
Nitrogenase complexes: multiple docking sites for a nucleotide switch protein.

Tezcan, F.A.Kaiser, J.T.Mustafi, D.Walton, M.Y.Howard, J.B.Rees, D.C.

(2005) Science 309: 1377-1380

  • DOI: https://doi.org/10.1126/science.1115653
  • Primary Citation of Related Structures:  
    2AFH, 2AFI, 4WZB

  • PubMed Abstract: 

    Adenosine triphosphate (ATP) hydrolysis in the nitrogenase complex controls the cycle of association and dissociation between the electron donor adenosine triphosphatase (ATPase) (Fe-protein) and its target catalytic protein (MoFe-protein), driving the reduction of dinitrogen into ammonia. Crystal structures in different nucleotide states have been determined that identify conformational changes in the nitrogenase complex during ATP turnover. These structures reveal distinct and mutually exclusive interaction sites on the MoFe-protein surface that are selectively populated, depending on the Fe-protein nucleotide state. A consequence of these different docking geometries is that the distance between redox cofactors, a critical determinant of the intermolecular electron transfer rate, is coupled to the nucleotide state. More generally, stabilization of distinct docking geometries by different nucleotide states, as seen for nitrogenase, could enable nucleotide hydrolysis to drive the relative motion of protein partners in molecular motors and other systems.


  • Organizational Affiliation

    Division of Chemistry and Chemical Engineering, California Institute of Technology, Mail Code 114-96, Pasadena, CA 91125, USA.


Macromolecules
Find similar proteins by:  (by identity cutoff)  |  3D Structure
Entity ID: 1
MoleculeChains Sequence LengthOrganismDetailsImage
Nitrogenase molybdenum-iron protein alpha chain
A, C
477Azotobacter vinelandiiMutation(s): 1 
EC: 1.18.6.1
UniProt
Find proteins for P07328 (Azotobacter vinelandii)
Explore P07328 
Go to UniProtKB:  P07328
Entity Groups  
Sequence Clusters30% Identity50% Identity70% Identity90% Identity95% Identity100% Identity
UniProt GroupP07328
Sequence Annotations
Expand
  • Reference Sequence
Find similar proteins by:  (by identity cutoff)  |  3D Structure
Entity ID: 2
MoleculeChains Sequence LengthOrganismDetailsImage
Nitrogenase molybdenum-iron protein beta chain
B, D
522Azotobacter vinelandiiMutation(s): 0 
EC: 1.18.6.1
UniProt
Find proteins for P07329 (Azotobacter vinelandii)
Explore P07329 
Go to UniProtKB:  P07329
Entity Groups  
Sequence Clusters30% Identity50% Identity70% Identity90% Identity95% Identity100% Identity
UniProt GroupP07329
Sequence Annotations
Expand
  • Reference Sequence
Find similar proteins by:  (by identity cutoff)  |  3D Structure
Entity ID: 3
MoleculeChains Sequence LengthOrganismDetailsImage
Nitrogenase iron protein 1
E, F, G, H
272Azotobacter vinelandiiMutation(s): 0 
EC: 1.18.6.1
UniProt
Find proteins for P00459 (Azotobacter vinelandii)
Explore P00459 
Go to UniProtKB:  P00459
Entity Groups  
Sequence Clusters30% Identity50% Identity70% Identity90% Identity95% Identity100% Identity
UniProt GroupP00459
Sequence Annotations
Expand
  • Reference Sequence
Small Molecules
Ligands 7 Unique
IDChains Name / Formula / InChI Key2D Diagram3D Interactions
ICS
Query on ICS

Download Ideal Coordinates CCD File 
J [auth A],
N [auth C]
iron-sulfur-molybdenum cluster with interstitial carbon
C Fe7 Mo S9
DDQFAOMIVKLFON-UHFFFAOYSA-N
CLF
Query on CLF

Download Ideal Coordinates CCD File 
K [auth A],
O [auth C]
FE(8)-S(7) CLUSTER
Fe8 S7
JKVMXLBGZBULKV-UHFFFAOYSA-N
ACP
Query on ACP

Download Ideal Coordinates CCD File 
R [auth E],
U [auth F],
X [auth G],
Z [auth H]
PHOSPHOMETHYLPHOSPHONIC ACID ADENYLATE ESTER
C11 H18 N5 O12 P3
UFZTZBNSLXELAL-IOSLPCCCSA-N
SF4
Query on SF4

Download Ideal Coordinates CCD File 
S [auth E],
W [auth G]
IRON/SULFUR CLUSTER
Fe4 S4
LJBDFODJNLIPKO-UHFFFAOYSA-N
HCA
Query on HCA

Download Ideal Coordinates CCD File 
I [auth A],
M [auth C]
3-HYDROXY-3-CARBOXY-ADIPIC ACID
C7 H10 O7
XKJVEVRQMLKSMO-SSDOTTSWSA-N
FE2
Query on FE2

Download Ideal Coordinates CCD File 
L [auth B],
P [auth D]
FE (II) ION
Fe
CWYNVVGOOAEACU-UHFFFAOYSA-N
MG
Query on MG

Download Ideal Coordinates CCD File 
Q [auth E],
T [auth F],
V [auth G],
Y [auth H]
MAGNESIUM ION
Mg
JLVVSXFLKOJNIY-UHFFFAOYSA-N
Experimental Data & Validation

Experimental Data

  • Method: X-RAY DIFFRACTION
  • Resolution: 2.30 Å
  • R-Value Free: 0.255 
  • R-Value Work: 0.204 
  • R-Value Observed: 0.207 
  • Space Group: P 21 21 21
Unit Cell:
Length ( Å )Angle ( ˚ )
a = 110.533α = 90
b = 120.894β = 90
c = 264.834γ = 90
Software Package:
Software NamePurpose
PHENIXrefinement
PDB_EXTRACTdata extraction

Structure Validation

View Full Validation Report


Ligand Structure Quality Assessment 


Entry History & Funding Information

Deposition Data


Funding OrganizationLocationGrant Number
National Institutes of Health/National Institute of General Medical Sciences (NIH/NIGMS)United StatesGM099813
National Institutes of Health/National Institute of General Medical Sciences (NIH/NIGMS)United StatesGM045162

Revision History  (Full details and data files)

  • Version 1.0: 2015-02-25
    Type: Initial release
  • Version 1.1: 2017-09-06
    Changes: Advisory, Author supporting evidence, Database references, Derived calculations, Source and taxonomy
  • Version 1.2: 2019-12-25
    Changes: Author supporting evidence
  • Version 1.3: 2024-02-28
    Changes: Advisory, Data collection, Database references, Derived calculations, Refinement description